Top 10 DAX Expressions in Power BI
As a Power BI trainer at Intellisoft Systems, and writer of several Excel & Power BI articles, I’ve worked with with over 15,000 business professionals, data analysts, and executives over the years.
When people first approach Power BI, they often marvel at how it brings their data to life with interactive dashboards and visualizations.
But as they dive deeper, they soon realize that Power BI’s true power lies not just in its visuals, but in its ability to manipulate, analyze, and derive insights from data using DAX (Data Analysis Expressions).
My Journey with DAX in Power BI
I remember my own journey into the world of DAX, which felt a lot like learning a new programming language. At first, the syntax was daunting, and it seemed like every time I thought I understood how a function worked, a new scenario would throw me off.
However, as I started teaching Power BI Courses around the world in our public classes at Intellisoft, and as I assisted hundreds of data analysts in creating their Business Intelligence Dashboards in Power BI, I noticed a pattern.
The same set of DAX expressions came up repeatedly as crucial for solving business problems, answering analytical questions, or building complex reports.
The beauty of DAX is that, once you grasp the core concepts, it opens up endless possibilities for data transformation and modeling. It’s not just about creating formulas—DAX helps you enhance your reports by extracting hidden patterns and making data-driven decisions easier.
With Power Query to Clean the Data, and DAX to enhance the analysis of data, it is the best of both worlds.
Why Create DAX Expressions?
In the world of data analytics, basic reports often don’t tell the full story. As professionals, we are expected to go beyond the surface-level numbers and reveal patterns & insights that drive business strategy.

Here’s why DAX expressions play such an essential role in this:
- Advanced Calculations: DAX allows you to perform calculations that Excel or standard report-building tools can’t easily handle. Whether it’s aggregating data across different periods, creating year-over-year growth metrics, or applying conditional logic, DAX gives you that edge.
- Data Relationships: Power BI thrives on relationships between datasets. DAX lets you define those relationships more clearly, ensuring that your reports reflect the real connections within your data.
- Custom Metrics: Every business has unique key performance indicators (KPIs) and metrics. DAX allows you to create custom measures that align with your organization’s needs, ensuring your reports are tailored to the business context.
- Dynamic Reporting: DAX enables dynamic filtering and context-driven calculations. This allows you to create reports that respond in real-time to user inputs, making your dashboards far more interactive and meaningful.
- Enhanced Performance: While Power BI’s drag-and-drop interface makes it easy to start, large datasets or complex models can slow things down. Writing efficient DAX expressions can optimize your data models, improve performance, and ensure that your reports scale with your data.
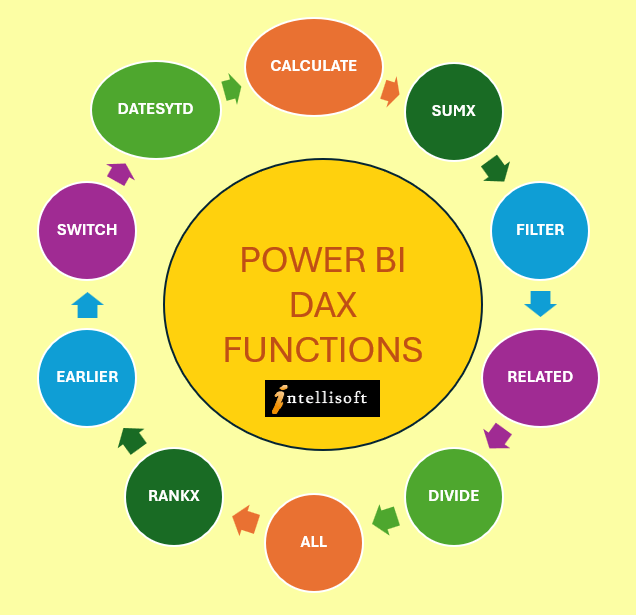
Top 10 Most Useful DAX Expressions in Power BI
Over the years, I’ve seen which DAX expressions are most commonly used and how they help professionals derive actionable insights. Here are the top 10 DAX expressions that every serious data analyst, executive, or manager should know:
- CALCULATE()
The most versatile DAX function. It lets you modify the context in which a calculation is performed. Use it to create measures that behave differently based on filters.Example:
CALCULATE([Total Sales], 'Calendar'[Year] = 2023) - SUMX()
A powerful iteration function. SUMX allows you to perform row-by-row calculations across tables. It’s essential for scenarios where you need to evaluate expressions in each row before summing the result.Example:
SUMX(Sales, Sales[Quantity] * Sales[Price]) - FILTER()
Used to return a table of data based on a filter expression. It’s particularly useful when working with complex conditions that you can’t handle with basic filtering.Example:
FILTER(Sales, Sales[Region] = "East" && Sales[Amount] > 10000) - RELATED()
This function retrieves related data from another table. It’s handy when you have a relationship between tables and need to pull in values from related tables.
Example:
RELATED(Products[Category]) - DIVIDE()
A safer way to perform division, it handles cases where division by zero would otherwise cause an error. It’s more reliable than the simple “/” operator.Example:
DIVIDE([Total Sales], [Total Units], 0) - ALL()
Removes any filters that may be applied to a column or table. This is useful when you need a calculation that ignores certain filters, such as when calculating overall totals.Example:
CALCULATE([Total Sales], ALL(Sales[Region]))
- RANKX()
Allows you to rank items based on a specified expression. It’s invaluable for comparing performance, such as ranking sales by regions or products.Example:
RANKX(ALL(Sales[Region]), [Total Sales])
- EARLIER()
Often used in calculated columns, EARLIER enables row-by-row context in calculations where you need to refer to previous row contexts.Example:
CALCULATE(SUM(Sales[Amount]), FILTER(Sales, Sales[Product] = EARLIER(Sales[Product])))
- SWITCH()
Functions like a multi-conditional IF statement, allowing you to return different values based on specific criteria.Example:
SWITCH([Rating], 1, "Poor", 2, "Average", 3, "Good", "No Rating")
- DATESYTD()
A time intelligence function that calculates the year-to-date total of a measure. It’s essential for tracking cumulative performance over time.Example:
DATESYTD('Calendar'[Date])
Microsoft is adding new DAX functions almost every month. There are already over 800+ DAX functions, whereas in Excel there are only about 400+ functions. Whatever calculation you are planning to build, there is most likely a DAX function that can be used to simplify the expression. It is worth learning new DAX functions and reviewing the entire function list to checkout the functions you can use immediately.
Conclusion
Mastering DAX is a continuous learning journey. It can seem overwhelming at first, but once you understand its logic and structure, you’ll realize how powerful it is in creating actionable insights and making sense of complex data.
In my Power BI classes, I always encourage participants to experiment with these expressions, building them into their regular reporting process. Once you start using DAX effectively, you’ll wonder how you ever managed without it.
Creating DAX expressions in Power BI allows you to push your data analysis skills to new heights. Whether you’re an analyst diving deep into data trends, or a manager looking for quick, actionable insights, these top DAX functions will empower you to extract the maximum value from your data models.