How To Clean Data Using Power Query

Power Query To Clean Data in Power BI and Excel

Data cleaning is one of the most critical steps in any data analysis process. Without clean, structured, and reliable data, insights drawn from analysis can be inaccurate or misleading.

In Power BI, Power Query serves as a powerful tool that allows users to connect, transform, and clean data efficiently, ensuring that it’s ready for reporting and analysis.

Whether you’re working with messy datasets from multiple sources, dealing with missing values, or eliminating duplicates, Power Query provides a simple, yet robust interface to clean data with minimal coding.Power Query To Clean Data in Power BI and Excel
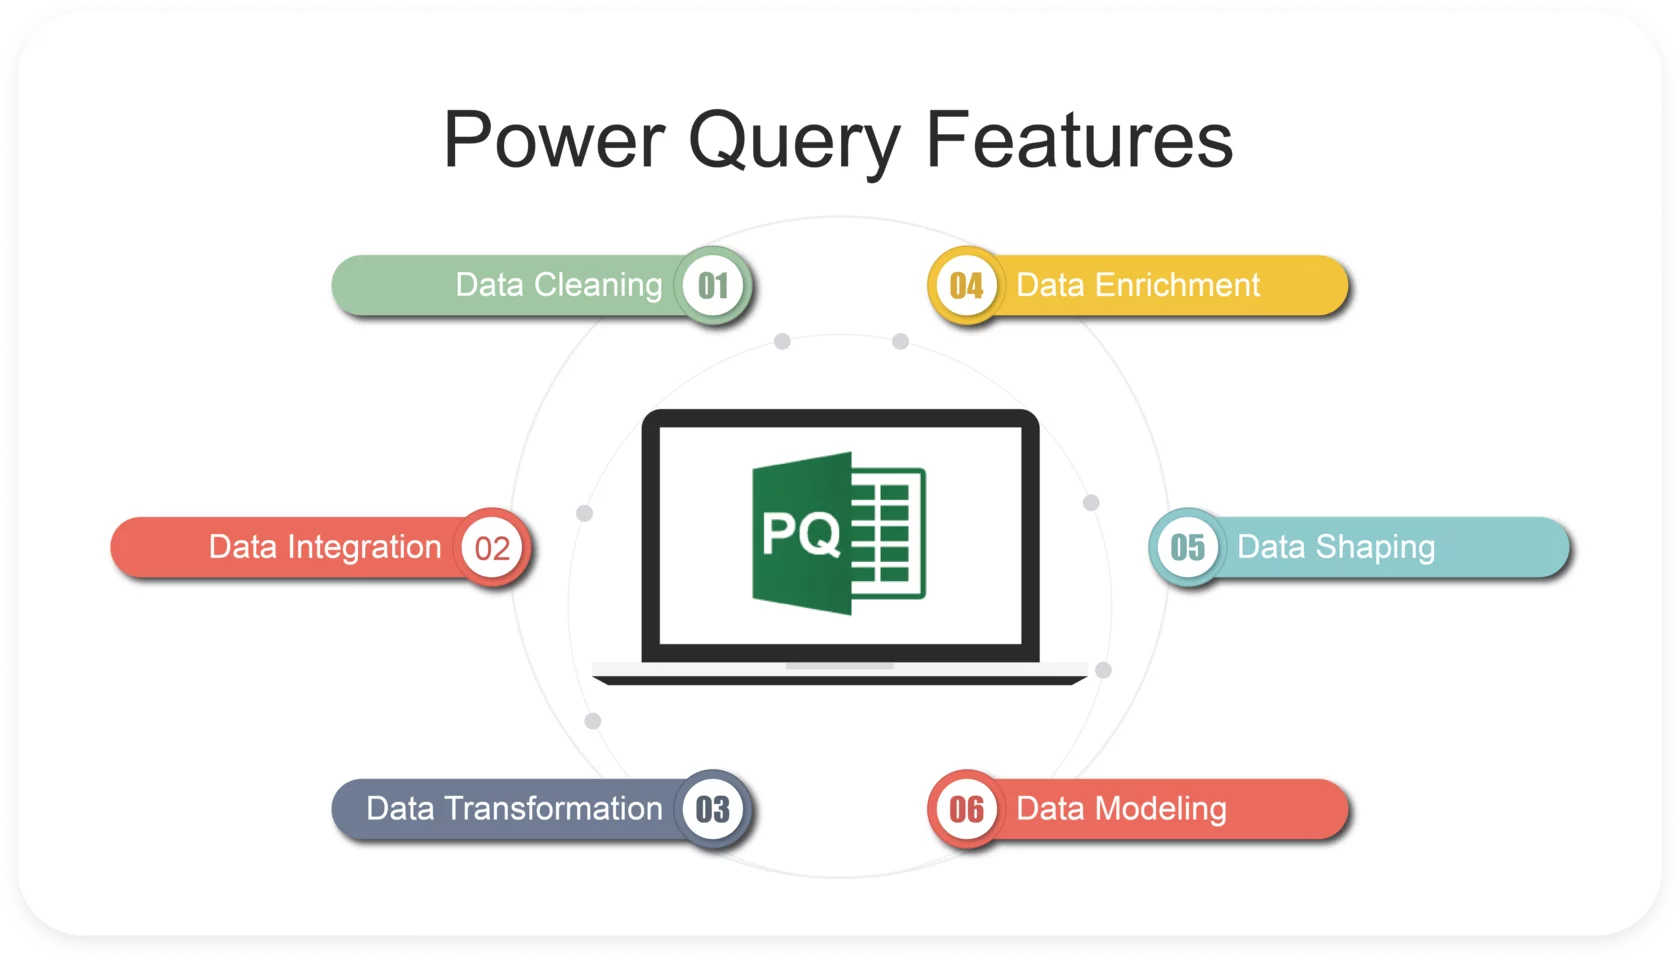
In this guide, we’ll walk through a 10-step process to clean data using Power Query, providing clear and actionable instructions to ensure your data is refined and ready for analysis.

10-Step Process to Clean Data Using Power Query in Power BI

  1. Load Data into Power Query
  2. Remove Unnecessary Columns
  3. Rename Columns
  4. Filter Out Unwanted Rows
  5. Handle Missing Values
  6. Change Data Types
  7. Remove Duplicates
  8. Trim and Clean Data
  9. Split and Merge Columns
  10. Apply and Load Data to Power BI

Step-by-Step Process & Details on How to Use Power Query in Excel / Power BI

1. Load Data into Power Query

The first step is importing your data into Power Query. This could be from an Excel file, SQL database, or other data sources.

  • How to do it: In Power BI, click on Home > Get Data. Choose your data source and load the data into Power BI. Then click Transform Data to open Power Query Editor.
  • Purpose: This step allows you to connect Power BI to your data source, bringing raw data into the environment for cleaning and transformation.

2. Remove Unnecessary Columns

Not all columns in your dataset are needed for analysis. Removing irrelevant columns helps streamline the dataset and improve performance.

  • How to do it: Select the columns you don’t need, right-click, and choose Remove Columns.
  • Purpose: This reduces the size of your dataset, making it easier to work with and removing noise that could affect analysis.

3. Rename Columns

Renaming columns improves readability and makes your dataset more understandable, especially when working with multiple datasets or sharing reports with others.

  • How to do it: Right-click the column header and choose Rename. Alternatively, double-click the column name to rename it.
  • Purpose: Clean, descriptive column names make it easier to recognize and use data fields in future transformations and analysis.

4. Filter Out Unwanted Rows

Filtering data ensures that only the relevant rows are kept for analysis. This is particularly useful when you have data entries like errors or outliers that can skew your results.

  • How to do it: Click the dropdown arrow in the column header and apply filters based on conditions (e.g., removing rows with zero values, errors, or irrelevant categories).
  • Purpose: Filtering reduces dataset size and removes irrelevant data, focusing on what’s important for your analysis.

5. Handle Missing Values

Data often has missing values, which can create issues in analysis. You can either remove rows with missing data or fill in values where appropriate.Use Power Query to Clean Data in Power BI. Join Hands on Training at Intellisoft Singapore

  • How to do it: Right-click the column and select Replace Values to fill missing data, or use Remove Rows > Remove Blank Rows to eliminate incomplete records.
  • Purpose: This ensures your dataset is complete or that missing data is handled in a way that doesn’t negatively impact your analysis.

6. Change Data Types

Correctly assigning data types (e.g., text, number, date) is crucial to ensure that Power BI interprets your data correctly.

  • How to do it: Select the column, then go to the ribbon, click on the Data Type dropdown, and choose the appropriate type (e.g., Decimal Number, Date, Text).
  • Purpose: This avoids issues like date misinterpretation or incorrect calculations due to mismatched data types, ensuring smooth analysis.

7. Remove Duplicates

Duplicated data entries can skew your analysis by inflating totals or introducing inaccuracies. It’s important to identify and remove any duplicates.

  • How to do it: Right-click the column where duplicates might exist, then select Remove Duplicates.
  • Purpose: Removing duplicates ensures that each data entry is unique, resulting in accurate and reliable reports.

8. Trim and Clean Data

Text data often comes with leading or trailing spaces or non-printable characters. Cleaning this data ensures consistency.

  • How to do it: Use Transform > Format > Trim to remove unnecessary spaces, and Clean to remove non-printable characters.
  • Purpose: Trimming and cleaning text data ensures consistency and prevents potential errors when joining datasets or conducting analyses based on string matching.

9. Split and Merge Columns

Sometimes, data is combined into one column and needs to be split (e.g., first and last names, date and time). Conversely, you may want to merge multiple columns into one (e.g., creating a full address from separate fields).

  • How to do it:
    • For splitting: Select the column, go to Transform > Split Column by delimiter (e.g., space, comma).
    • For merging: Select multiple columns, right-click, and choose Merge Columns.
  • Purpose: Splitting and merging columns helps you organize your dataset in a way that aligns with your analytical goals.

10. Apply and Load Data to Power BI

After completing the data cleaning, the final step is to apply your transformations and load the data back into Power BI.

  • How to do it: Click Home > Close & Load. This will apply all transformations and load the clean data into Power BI for analysis.
  • Purpose: This finalizes the cleaning process and makes your data ready for visualization, reporting, or further analysis in Power BI.

Conclusion

Cleaning data with Power Query is a vital part of any data analysis process in Power BI. These 10 steps will help ensure that your data is clean, reliable, and ready for actionable insights. By following this structured approach, you’ll minimize errors, streamline analysis, and set the foundation for building accurate and meaningful reports.
 

How Can AI Tools Help You At Work

Learn Ai Tools in Singapore with Intellisoft

I recently received a question from a prospective learner about how AI Tools can help them in their work when they were browsing our website for WSQ AI Tools Course in Singapore. And I keep receiving similar questions, because there is a lot of misconceptions about AI Tools – what they can do and cannot do… specifically, how they can help in the workplace.

Questions like: “I just wanted to know how this course will benefit my current working environment.

We have a WSQ Course on AI Tools – Digital Transformation with AI Tools, where we teach how to use this new and emerging technology for serious work at the workplace. To clarify on this, let me dive deeper into this topic.

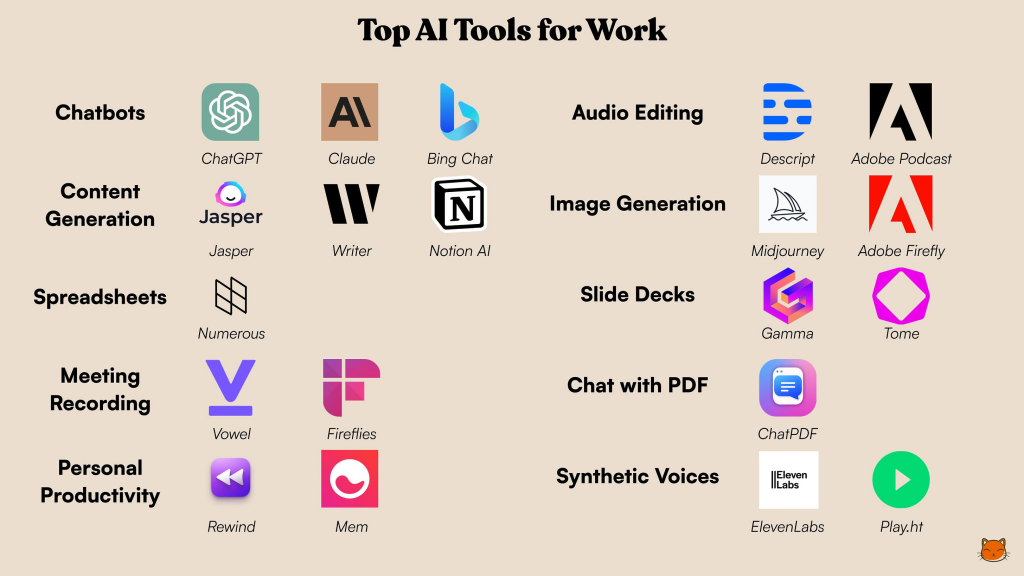
Here’s how each of these AI tools can be beneficial for your work:

1. ChatGPT (AI-Powered Writing and Communication Assistant) – From OpenAI

  • Content Creation: ChatGPT can help you generate high-quality content for emails, reports, presentations, and social media posts, saving you time and ensuring consistency in tone and style.
  • Customer Support: It can assist in drafting responses to common customer queries, enabling faster and more accurate communication.
  • Idea Generation and Brainstorming: Whether you’re stuck on a project or need fresh ideas, ChatGPT can offer suggestions, helping you think outside the box.

2. Gemini (AI Data Analytics and Insights) – From Google

  • Data-Driven Decisions: Gemini can analyze large datasets and provide actionable insights, making it easier for you to understand trends and make informed decisions.
  • Predictive Analytics: It helps in forecasting outcomes based on historical data, which can be critical for strategic planning and resource allocation.
  • Automation of Routine Analysis: Gemini can automate repetitive data analysis tasks, allowing you to focus on higher-value activities.

3. Copilot (AI-Assisted Coding and Development) – From Microsoft

  • Code Suggestion and Completion: Copilot can help you write code faster by suggesting snippets and completing code as you type, reducing errors and speeding up development.
  • Learning and Upskilling: Even if you’re not a developer, Copilot can help you understand and learn coding basics, making it easier to collaborate with technical teams.
  • Automating Repetitive Tasks: Copilot can assist in automating routine coding tasks, freeing up time for more creative and complex work.

4. Other AI Tools

  • Automating Administrative Tasks: AI tools can automate scheduling, email filtering, and data entry, allowing you to focus on more strategic aspects of your role.
  • Enhancing Creativity and Innovation: AI can help you explore new approaches to problem-solving and product development by providing insights and suggestions you might not have considered.
  • Personalization: AI tools can help tailor customer experiences by analyzing data and suggesting personalized content or solutions, leading to better engagement and satisfaction.

Overall Benefits

  • Increased Efficiency: Automate repetitive tasks and streamline workflows, giving you more time to focus on high-impact activities.
  • Improved Decision-Making: Leverage data-driven insights and predictive analytics to make more informed decisions.
  • Enhanced Creativity: Use AI to generate new ideas, approaches, and solutions to complex problems.
  • Skill Enhancement: Learning to use these tools will expand your skillset, making you more adaptable and valuable in your current and future roles.

By the end of the AI Tools for Digital Transformation course, you’ll be equipped to integrate these AI tools into your daily workflow, boosting your productivity, enhancing your decision-making capabilities, and helping you stay competitive in a rapidly evolving digital landscape.

Other Useful AI Tools

  1. Grammarly
    • Writing Assistant: Grammarly offers AI-powered suggestions for grammar, style, and tone, helping you write clear and effective content. It’s available as a browser extension, making it easy to use across different platforms.
  2. Notion AI
    • Content Creation and Organization: Notion’s AI features help you brainstorm,
    •  summarize, and generate content directly within your notes and documents, making it a versatile tool for personal and professional use.
  3. Jasper (Free Trial)
    • AI Content Generator: Jasper (formerly Jarvis) helps you create content for blogs, social media, and marketing campaigns. It offers templates and suggestions tailored to different writing needs.
  4. Otter.ai
    • Transcription and Note-Taking: Otter provides real-time transcription of meetings, interviews, and lectures, making it easier to capture and share key information.

By incorporating these AI tools into your workflow, you can enhance your productivity, streamline creative processes, and elevate the quality of your work, regardless of your current working environment.

Additional AI tools (Image Editing, Video Editing, Slide Creation, and More)

Image Editing

  1. Canva (Free Plan)
    • Design and Editing: Canva offers AI-powered tools for graphic design, allowing you to create professional-looking images, social media graphics, and presentations with ease.
    • Magic Resize: This feature automatically resizes your designs for different platforms, saving you time and ensuring consistency across various formats.
  2. Remove.bg
    • Background Removal: This free tool uses AI to quickly remove backgrounds from images, making it easier to create clean and professional visuals.
    • Integration: You can use it directly within Canva or download the edited images for use in other applications.
  3. DeepArt
    • Artistic Filters: DeepArt allows you to apply AI-generated artistic styles to your photos, transforming them into artwork inspired by famous artists like Van Gogh or Picasso.

Video Editing

  1. Kapwing
    • Online Video Editor: Kapwing offers a suite of AI tools for video editing, including trimming, resizing, and adding subtitles. It’s user-friendly and doesn’t require any prior editing experience.
    • Smart Cut: This AI feature helps in automatically cutting out silent or less interesting parts of a video, making the editing process faster.
  2. Descript
    • Transcription and Video Editing: Descript is a powerful tool that offers transcription services and lets you edit videos as easily as you would edit a text document. You can also use its overdub feature to correct spoken errors in videos.
  3. Pictory

    • AI Video Creation: Pictory allows you to create short, branded videos from long-form content like webinars or blog posts. It automatically extracts key points and generates engaging videos.

Slide Creation

  1. Beautiful.ai
    • AI-Powered Presentation Design: Beautiful.ai helps you create visually appealing presentations by automatically adjusting the layout and design as you add content, ensuring professional-quality slides.
    • Templates: It offers a range of smart templates that adapt to your content, saving you time and effort.
  2. Tome
    • Narrative Design Tool: Tome uses AI to help you build compelling visual narratives, perfect for presentations or storytelling. It allows you to quickly integrate multimedia elements and designs into your slides.
  3. Designs.ai
    • Slide and Video Creator: This tool offers a suite of AI-driven features for creating presentations, videos, logos, and other digital assets. It’s particularly useful for generating ideas and visuals quickly.

The AI Tools industry is in its infancy. New tools are emerging every single day, and the improvement in the tech is simply exponential. With so many tools, it is difficult to choose, and often people are lost in the sea of hundreds of AI Tools to choose from.

If you are not sure which AI tool can help you, simply join our WSQ Funded AI Tools course in Singapore. Our AI Expert Trainers will guide you in the best tools to use, and how to use them. With step-by-step knowledge, use of the best prompts (Prompt Engineering), and some best practices in AI, you will be in on your way to shine in the workplace in no time!

Digital Transformation Course in Singapore

Cheers,
Vinai Prakash
Founder & Master Trainer, Intellisoft Systems & Intellisoft Training, ExcelChamp, PMChamp.

How To Calculate Customer Engagement Using Social Media?

How To Calculate Customer Engagement Using Social Media?

The rising engagement of people in social media platforms have attracted all the brands towards social media. So, Brands have started to craft graphical story around the key brand value and offerings for better Customer Engagement using Social Media.

The challenge today is to find how engaged are your customers with your Social Media Pages. This needs to be measure & tracked to ensure enough ROI is being generated for the time & resources spent.

If you are a Digital Marketer, having a proper Strategy & Implementation in Digital Marketing is the only way to reach target audience. Also, to generate good ROI.

Let us discuss the social media engagement steps from strategy to Implementation that will improve the ROI & Customer Engagement.

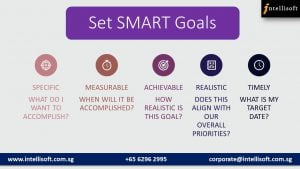
  1. Set SMART Goals:

There’s no denying that social media can be a powerful tool, but too often companies caught up in producing a stream of content. But, they don’t think about the big picture.

Whether its corporate, marketing, branding or Customer relationship management, it will work better if the goals are shaped around the key business objective.

Leat to set SMART goals for Better Customer Engagement at Intellisoft
SMART goals for Better Customer Engagement in Social Media

Select several goals that are most important to your business and are feasible to achieve.

The goals can be:

  • Awareness
  • Customer Retention
  • Branding
  • Lead Generation
  • Promotion
  • Referral Traffic
  • Sales
  • Launch
  • Loyalty

By curating the goals you can easily think of themes, content brackets, visuals & platforms. If you think its limiting, its quiet opposite. In fact, it gives a clear understanding and vision of accomplishments.

Do check out our Insightful Article on the 10 Exciting Tips for Engaging on Instagram

  1. Analyze Your Social Media Marketing Strategy:

Once you have defined the big-picture, it is important to stack your efforts in right way. It is important to analyze how you allocate the content. This is to make sure the contents are in alignment with the goals and key business objectives.

Learn to Analyze the Customer Engagement Strategy at Intellisoft Singapore
Learn to Analyze the Social Media Marketing Strategy at Intellisoft Singapore

Curate a system to measure the social media content efforts to support your goals. First, create a basic spreadsheet of content, time and engagement. It can be filtered to analyze later.

Here are the few questions to start your analysis with:

  • What is my post frequency?
  • What topics do I post most frequently about?
  • Is my brand’s voice, personality and objective coming through my post?
  • What characterizes my post?
  1. Implement Your Game Plan:

Goals may be the backbone of the marketing program, but translating the to a powerful content will take you a long way. Think of each piece of content you share as a larger story your brand / company wants to communicate.

In fact, each content should have a clear theme, point of view and a take away for the consumer.

Learn to Implement your Marketing Strategy at Intellisoft Singapore
Learn to Implement your Social Media Marketing Strategy at Intellisoft Singapore

Here are some ideas of Implementation:

  • Post Regularly & Be active
  • Communicate Promotions, Offers and Services
  • Respond quick for customer engagement
  • Mix up types of contents
  • Show the usefulness and lifestyle
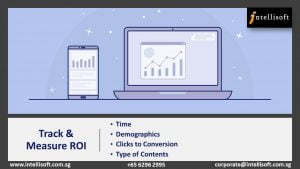
  1. Track & Measure ROI:

Looking closely at the implementation, the next step would be tracking of the engagement.

Learn to Track & Measure ROI with Insights at Intellisoft Singapore
Learn to Track & Measure ROI with Social Media Insights at Intellisoft Singapore

Track the insights & engagement to streamline the efforts better. You can easily track the following:

  • Time people are Viewing your post
  • Demographics of the people engaging
  • Tracking the Clicks to Conversion
  • Type of Contents that gets the more engagement. For instance – Inspirational Quotes, Texts, Videos, Images, GIF, Info-graphics

Track the content themes & decide frequency based on the engagement metrics. Alter the frequency, time  & Content Strategy based on the insights.

Qualitative content wins. Focus on the content that generate strong leads, keep in track of loyal consumers, a responses from star consumer, and add them to further posts.

This might be a little hard to keep in track but its valuable to capture them and add because ultimately not always number wins, but satisfaction & reviews do.

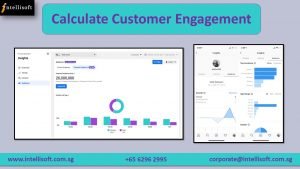
How To Calculate Customer Engagement using Social Media?

Here are some quick ways to calculate engagements:

  • Look for Virality in your Facebook page analytics. It shows the likes & shares for your better understanding too.
  • Instagram: Enable insights from settings & start to track insights in every post. Therefore, you arrive at a better understanding of the reach.
Learn to Calculate Customer Engagement With Insights at Intellisoft Singapore

All these are a just perspective ideas & guidelines. But, it is always good to master the skill for desire outcomes.

Intellisoft has carefully designed a highly insightful Digital Marketing Course to help you learn & master the Social Media platforms to get your Brand, a great value.

Learn how to improve the current marketing activities & get them to perform at their very best, therefore getting the maximum ROI from them.

Why wait? Join us today & master Digital Marketing starting from S$61.25*. You can claim that also from SkillsFuture.

Register Online now for the 2 days practical hands-on course to get the most out of Digital Platforms.

We are here to assist you if you have any more questions on the Course.

Feel free to call me at 9343-2080 or Email us to request brochure or any other queries.

Cheers,
Lavanya
Tel: 6250-3575  Whatsapp:  9343-2080  | corporate@intellisoft.com.sg

Like us on Facebook, Follow us on Instagram & LinkedIn for more updates on Courses & Grant!

P.S: Do check out the interesting Article on 5 Tips to Improve your Business Search-ability in Google

What is Your Next Step After Learning Excel?

What is Your Next Step after Learning Advanced Excel?

What is Your Next Step After Learning Excel?

Wondering what to pursue after learning Excel? Let us find the answer. Before that, let’s first read a quick short story.

Once upon a time, a very strong woodcutter asked for a job in a timber merchant. The pay was good and so were the working conditions. So, the woodcutter was determined to do his best.

His boss gave him an axe and showed him the area where he would work.

The first day, the woodcutter felled 18 trees.

“Congratulations,” the boss said. “Go on that way!”

Motivated by the boss words, the woodcutter tried harder the next day, but he could only bring down 15 trees. However, the third day he tried even harder, but he could only manage 10 trees. Day after day, he finished with fewer trees.

“I must be losing my strength,” the woodcutter thought. He went to the boss and apologized, saying that he is week and could not understand what was going on too.

“When was the last time you sharpened your axe?” the boss asked.

“Sharpen? But I’ve had no time to sharpen my axe. I have been so busy trying to cut trees….”

This story states that equipping yourself shouldn’t ceases & sharpening the tool set & keep you updated is the only way to a long term success.

Now, why are we reading to this story?

Let me jump to the point directly.

The world is fast paced. So, we need to have the required tools ready & sharp for use. 

It is almost impossible to find work that does not require some amount of Excel. Having the right skills for using and applying Excel for Simple or Advanced tasks is a must.

Microsoft Excel is one of the most valuable skill sets that can take you far!

However, most of you already know & use Microsoft Excel quite well. Really glad to know that. Still, sometimes even experienced Excel experts miss out on the best features of Excel that seem to be hidden.

Is it Sufficient to know Excel well to prove yourself in this competitive world?

Are you ready for the Future?

Learning never ceases and you should keep updating you to keep you in par with the emerging industry and not becoming outdated.

You should grab other Skill set after finishing Microsoft Advanced Excel to keep growing in the Job Industry.

AVAILABLE OPTIONS AFTER MASTERING MICROSOFT EXCEL

Let us discuss the variety of options available in front of you to pursue using the Advanced Microsoft Excel Skills that open you up to various career prospects in addition to career growth.

  1. ATTEND SQL WORKSHOP:

I am an Excel Expert. How do I get into Data Analysis?

I am an Analyst. But I always stand at the mercy of IT peers to query my Data!

Are you relating to these situations?

Let’s talk about the first step you can take to resolve this.

Analysis comes into play only after you have the set of relevant information in your hand that are clean as well.

When you yourself can query data from the relational Database system & reorganize, then certainly you are independent, and you can control your own productivity & efficiency.

Learning the right tool to collect & organize your data can be a savior. If you don’t know what is SQL & Why should you learn it, get yourself acquainted first.

Learn SQL to query any databse at Intellisoft Singapore
Learn SQL to query any Database at Intellisoft Singapore

SQL could be the priority as it is an easy to learn, straight-forward programming language. It is a simple but popular program for Data Management.

Administering, updating, maintaining, and manipulating the database is easy with SQL.

With SQL you can – retrieve, analyze and report information quickly and efficiently.

Wondering How to Learn SQL Fast?

Grab SQL Skills today to be an independent analyst otherwise make a new career as Data Analyst, Database Administrator, Data Scientists or even Data Architect at Intellisoft Singapore.

  1. Join Excel VBA (Macro) Course:

I am an Excel expert. Do I only get to learn the skills that are into Data Analysis?

Well definitely not. As we have already discussed Excel is a program that is used in all the fields in which the Data Analysis is just a new popular.

Excel could be enhanced with further skill sets and utilized in various tasks as well.

One such skill set that is highly useful for people into leadership, or managerial position to review the work or report, or even for someone who is into repeating the functions, formulas, or a set of same steps dozens of times every day.

There is a boon to such people – Macros in Excel.

You can write & record macros for simple to complex steps that you accomplish every day. In addition to that, Macro Code runs much faster and save a huge amount of time, which in turn will increase productivity.

After all, you don’t get bored of what you are doing every day.

Learn to Automate repeated Steps with VBA at Intellisoft Singapore

Looking to learn VBA (Macros) faster?

Join an Excel VBA (Macro) training at Intellisoft Singapore today to Learn practical ways to automate tasks & build a better workflow with VBA Macros and automation in your work.

  1. Data Interpretation & Analysis with Excel:

Data Analysis is a cool and exciting career to get into. When you already are aware of the Excel tool kit, now it’s time to learn the Techniques of Analyzing Data with Excel.

Data Analysis is a process of using logic & statistics to answer some of the business questions which consequently leads to decision-making.

You can learn to understand data and forecasting based on different criteria.

Charts & Modelling can be made using the Excel Features.

Correlation & regression techniques can be used to Analyze Data with different variables.

Data Interpretation & Analysis with Excel Training at Intellisoft Singapore

Above all, It is wise to grab the techniques of using the tool effectively, when you are an Excel Expert Already!

Wondering why you should learn Data Analysis? Check out the top 5 Cool Career Options that rely on Data Analysis

Also Join Intellisoft now to Grab Data Analysis Skills fast.

  1. Create Interactive Management Reports & Dashboards with Excel:

A Dashboard is the dynamic reporting technique used in business data reporting.

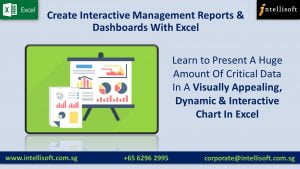
If you can present a huge amount of critical data in a Visually Appealing, Dynamic & Interactive Chart in Excel, apparently the decisions are made faster & you are the star of the boardroom already!

 Visually Appealing, Dynamic & Interactive Report in Excel
Visually Appealing, Dynamic & Interactive Report with Excel Dashboard at Intellisoft Singapore

Why wasting time, learn Excel Dashboard & report metrics that matter!

Well, I hope that you now have a clear idea of  What can you do after learning Advanced Microsoft Excel!

Take a breath! Make time out of your calendar to learn the essential skills that matter!

Best of Luck!

Cheers,
Lavanya
Like us on Facebook, Follow us on Instagram & LinkedIn for more updates on Courses & Grants.

What is Power BI: A Must-Have Skill For Analysts & Decision Makers

How to Use Power BI at Intellisoft Singapore classroom Training

What is Power BI: Intro to the Most Powerful Visualization Tool from Microsoft

The world runs with Technology but ruled by Data. Learning to process, manage, analyze and present data can lead to a flourishing Career Path.

Becoming a Data Analyst is the new cool. Data analysis as a career path has a bright future and a variety of options become available to keep moving ahead in your career.

The Data Analyst career path starts from grabbing the right Skills. While it needs a basic knowledge of SQL for querying Data and Python fundamentals, it a very much mandatory to upgrade yourself with the Key Skills like Advanced Microsoft Excel and Power BI.

We all have heard of SQL, Python and Microsoft Excel, but you may not be familiar with Microsoft Power BI.

Let’s find out What Power BI is, and How you can benefit from learning & using Power BI.

Why Microsoft PowerBI is Essential For Data Analysis?

Power BI is an intelligent software that is highly equipped to Analyze data and gain Insights quickly, without any fuss.

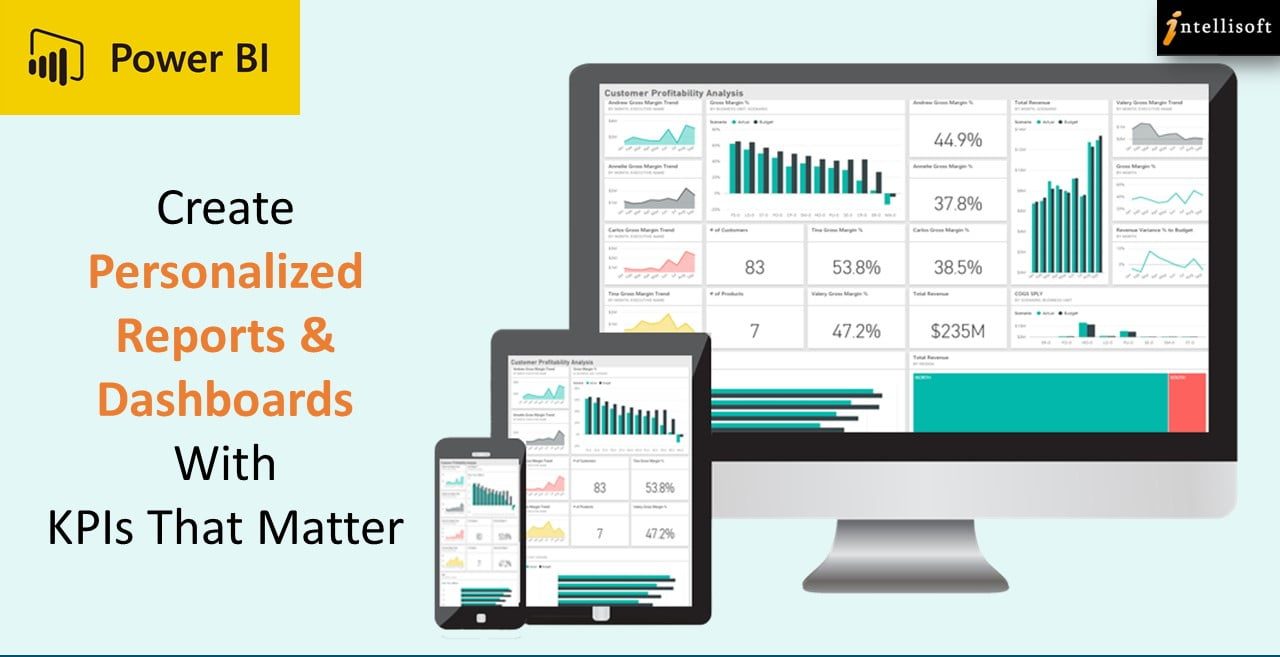
You can visualize data and create personalized reports & dashboards with KPIs that matter in your Business.

It is very popular among Data analysts because of the Speed, Accuracy, Consistency, and Security. You can set the report to refresh automatically, and inform the key stakeholders to view it on their i-Pads and Mobile phones.

The reports and insights can be collaborated effectively across all the different Software’s like Excel, SalesForce, SharePoint, SAP, Oracle Database, and even Microsoft Teams. This allows the whole team to get involved in Data Driven decision making.

Extensive Connections & Flexibility in Power BI

Microsoft Power BI has a growing Library of 100+ connectors that comes for Free and connects it to various Cloud based platforms like SQL, Salesforce and SharePoint.

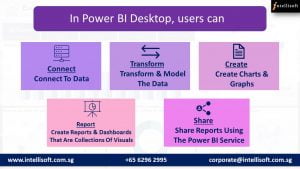
In Power BI Desktop, users can:

What Power BI Can Do: Benefits of Microsoft Power BI
  • Connect to data
  • Transform and model the data
  • Create charts and graphs
  • Create reports and dashboards that are collections of visuals
  • Share reports with others using the Power BI service

What’s covered in Power BI Training?

This PowerBI MasterClass teaches the skills a business analyst needs to know in order to successfully use Power BI, Write DAX Measures and Use Power Query to Clean and Load data.

The course starts out first by highlighting the key Advanced Excel functionality useful for data analysis, and then moves to Power BI tools. We cover Microsoft Power Query, Power Pivot & Power BI – all built into the new Power BI Desktop Application.

This Practical, Hands-on workshop covers:

  1. Importing and creating relationships between tables of data.
  2. Understanding the optimal data structure to use in PowerBI.
  3. Writing basic Data Analysis eXpressions (DAX) formulas to extract business insights.
  4. Then writing more advanced DAX formulas that use the power of DAX to extract additional business insights from the data that are not immediately obvious (yet are inherently available).
  5. An introduction and overview of Power Query, how to use the tool to build data extraction and cleaning scripts, and why it is so great.
  6. Helping Excel professionals move from being a normal user in Excel to being a Power BI analyst, covering the differences between the tools and how to start using Power BI Dashboards effectively.

You Can Learn Power BI in a Classroom Setting

Unlike the other Basic computing software’s, Power BI should be learnt and mastered through a proper Training or a Master Class to make you understand the Power BI suite of products available from Microsoft, and be a Power Ninja in analyzing, visualizing & understanding Business Intelligence Reporting.

You should attend a Focused, instructor-led power packed program that make you

Focused Instructor Led Power BI Course in Singapore
  1. Understand Power Query & DAX, and how to apply it to your job.
  2. Achieve better and faster results than with existing Microsoft tools.
  3. Produce valuable KPI metrics for your business that never existed before.
  4. Learn best tips & tricks to solve complex problems & create stunning work.

Where can I Attend Power BI Course in Singapore?

Intellisoft Systems offers you an intensive Power BI Training in Singapore for 2 days.

Our expert approach in this classroom training course makes it accessible to become an Excel Pro.

At the end of the 2 days, you will be well on you way to becoming a Power BI, Power Pivot and Power Query Ninja!

What are the Pre-Requisites to Learning Power Query, Power Pivot & Power BI

You can easily learn Power BI f you have Basic knowledge of Excel, and can write simple formulas like SUM, IF, Nested IF, and:

Note: Anyone with a Database, BI, Programming, or similar experience are quite qualified to take this course, even if lacking in Excel experience.

Thousands of people like you have attended our training & started analyzing data, in Sales, Customer Service, Finance, Logistics, HR, Business & other functions in no time.

Gain Valuable Insights by Visualizing Data Quickly!

Whether you work in Banking, Marine & Offshore, Telecom, Networking, IT, Manufacturing, Services, Government or Healthcare, you must tap on the Best and Most Useful software for Data Analysis & Business Intelligence – POWER BI.

Go Beyond Excel Pivot Tables, Learn Power BI now!

Where: Intellisoft Systems, Singapore

You can Register Online or contact us to block seats for you while you get internal approvals.

Individual Singaporean can use their SkillsFuture Funds to offset the course fees.

Why wait? Join Intellisoft now! Please call or Email me to reserve your spot on this Power Pivot and Power BI for Excel Training Program.

Like us on Facebook, Follow us on Instagram and Do Check out our LinkedIn for more updates on the Courses & Grants!

P.S: Looking for cool Careers? Check out the Top 5 Cool Careers in the Job market!

Article Written by Vinai Prakash, MBA, PMP, GAP, ACTA Certified

Additional Resources for Power BI

Training Courses

Data Analytics & Visualization with Power BI

Learn Microsoft Power BI Suite For Better Data Analysis & Reporting

Power BI Tips, Tricks & Video Tutorials

Power BI Tip #2: Reference Query Results in Another Query With Power Query [Video Tutorial]

Microsoft Power BI: Super Charge Your Data Analysis Process

Power BI Tip #6: Fixing The Vertical Axis in Power BI Visualisations

Power BI Tip #5: All About Slicer Controls in Power BI

Power BI Tip#4: Enter Data Into Power BI Quickly [Video]

Power BI Tip #3: Quick Formatting of Power BI Visuals

Microsoft Project: An Ultimate Tool For a Successful Project

Features of Microsoft Project

Project managers are the amazing people in companies, that get the job done. They strategize, plan, build, enhance and repair, and finally get the project delivered.

Constantly fighting tight resources, a short timeline, and minimum budgets, they handle multiple projects at the same time, and still are able to deliver to the client.

Their main job is to handle people, tasks, timeline, resources and even the overall Project goals & objectives.

It is not an easy job to be the Project Manager. Since the job is bound to have frequent changes, it can easily become confusing, chaotic and unorganized.

Therefore, it is even more critical that a project manager is a master of the management software that can save his time and increase efficiency.

Using & following a trusted, tested and reliable project management tool, Project Managers make it easy to organize, collaborate, and administer.

5 Reasons Why You Should Learn Microsoft Project

How will a Project Management Software work?

Microsoft Project, the ultimate management software has all the necessary features to help efficiently planning of projects, managing the resources, responding to issues, and keep all the authorities involved.

Regardless of the kind of project you handle, Microsoft Project will create a positive impact in Planning & Executing the project.

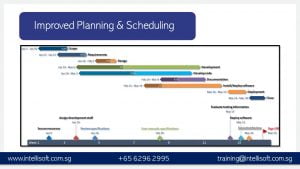
  1. Improved Planning and Scheduling

Microsoft Project Training in Singapore for Improved Planning and Scheduling

  • Project planning and scheduling is the primary stage of a Project management which decides the whole flow of the work.
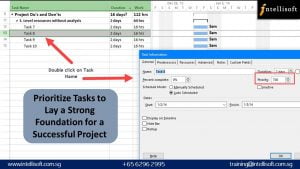
  • With Microsoft Project, managers can easily create an actionable plan and prioritize the tasks to drive the project towards a success.

Microsoft Project Training in Singapore

  • It becomes easy to allocate resources, identify dependencies, set up deadlines, and to create project deliverables in no time.
  • Microsoft Project helps to lay a strong foundation for a successful project and to efficiently manage the project until the end.
  1. Better Collaboration

  • Teamwork is the mandatory aspect of a successful Project. A team can comprise of members from various departments.
  • They are required to handle their day-to-day responsibilities and to contribute to multiple projects at a time which in turn makes it difficult to be present in all the discussions & meetings.

Microsoft Project Training in Singapore: Learn Effective Collboration & Project Handling

  • This communication gap can create unnecessary delays in the projects and problems that can waste a lot of precious resources.
  • A huge advantage of the Microsoft Project is that it makes effective collaborations in a project extremely simple.
  • All the important insights, project timeline and status updates can be accessed by all the authorized team members with a single click and important alerts can be automatically sent to the relevant parties.
  1. Budget Management

  • The ultimate use of the Microsoft Project software is the budget management. Since the resource management becomes effective, its easy to see where the budget is being spent, and if it is allocated properly.

Microsoft Project Training in Singapore for Effective Budget Management

  • You can then play what-if analysis, and see projections of the project – if it is delayed slightly, delayed a lot, and major breakdowns… what will be the cost of the completed project.
  • It is also effective in real-time management and update of Budget allocation & usage for better understanding and streamlining.
  1. Remote Working

  • In view of the uncertain situations like current pandemic, it is absolutely impossible to stay in touch and discuss physically with all the department.
  • The physical location does not bind modern projects.

Microsoft Project Training in Singapore for Effective Project Management

  • It could be tough to manage the scattered workforce With Microsoft Project, it becomes easy to manage and lead the teams effectively.
  • The tasks assigned are clear and legible that there is no chance of confusions or misunderstandings.
  1. Enhanced Productivity

  • Another major advantage of using Microsoft project software is that it optimizes your decision-making process and improves productivity at work.

Microsoft Project Training in Singapore for Productive, effectient Project Management

  • As all of the important details can be found in a single place, you can always make informed decisions within the shortest time.

Join Us today to Learn more!

Free Tips, Tutorials & Training Grants Info

Learn from expert tips, tricks and resources for Excel, PowerPoint, Photoshop, Python, Power BI, Project Management, IT, Soft Skills & more with our Email Newsletter.
Plus get the latest news on Grants. Join Today!

Found What You Were
Looking For?

Just Tell us...

We're Here To Help You!