How To Write Excel Formulas

Learn Excel at Intellisoft

Do You Know How to Write Excel Formulas?

Chances are that you can only click on the Autosum button to add a few numbers. If you have never written a single formula in Microsoft Excel, fret not. It is not difficult at all. In fact, with our step by step Excel training, you will be able to write Excel formulas in no time.
Advanced Excel training at Intellisoft in Singapore

The real power of Microsoft Excel is the usage of Formulas. This is what differentiates it from Paper or Typewritten Reports. With the use of Formulas, Excel can calculate and update the totals, and complex calculation or computations on the fly.

How Excel identifies Rows and Columns

Excel uses a simple numbering system to differentiate between cells. Each cell or box that you see in an open Excel file has a unique number – pretty much like the pigeon hole letter box that each house has. Each letterbox number is unique, making the life of postmen easier.

In Excel, Rows are numbered from 1 onwards. These Rows appear on the Left of your screen.
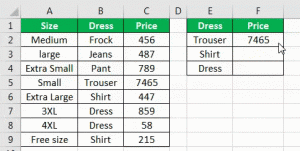
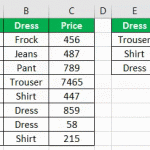
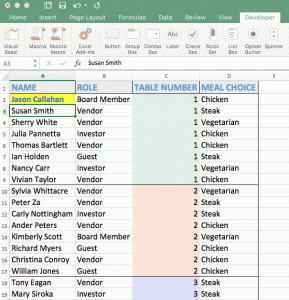
Excel VLookup Sample
Excel VLookup Sample Setup

For Columns, it uses alphabet combination – like A, B, C, and when it comes to Z, it starts with AA, AB, AC and so on.

So the first cell cross-section of column A and row 1 is called A1, column M and row 5 is called M5. Simple huh?

Using Rows & Columns in a Formula

How does these unique references to each cell make a difference? Well, let’s say you want to add the total of A1 and A2  in the cell A10. All you need to do is to go to A10 cell, and then start to write a formula.  A formula begins with the = sign.

So you are at A10. Key in =A1+A2 and hit the enter key.

That’s it. You see the totals of A1 & A2 show there.

Go ahead. Fire up Excel. You can’t learn Excel by looking at tutorials. You have got to try it out, and practice. Practice makes you perfect.

Exercise:

  1. Key in 20 in cell C1, 30 in cell C2, and 40 in cell C3.
  2. Then go to cell C4, and key in the formula to calculate the total.
  3. If it matches 90, you have got it correct!
  4. Congratulations. You are on your way to write Excel Formulas and get better at computing using Microsoft Excel.

Cheers,
Vinai Prakash
founder & principal trainer at Intellisoft Systems Singapore.

Looking for Microsoft Advanced Excel Training? You have come to the right place

Contact us at +65 6250-3575 for any questions, or to join our upcoming classes in various versions of Excel.

What are you using Microsoft Excel for?

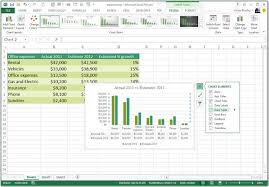
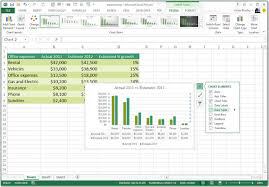
excel_2013_chart
Excel Chart
Excel Chart

Most people learn Microsoft Excel by hit and trial. As soon as someone explains, or they figure out how to write a simple formula to add two numbers, they think that they know everything about Microsoft Excel.

Nothing could be far from the truth! There is much more to Microsoft Excel than just adding numbers.

And I have even seen people using a Calculator even when a Microsoft Excel spreadsheet is open.

Right out of the box, Microsoft Excel, whether Excel 2010, Excel 2013 or Excel 2016 can do wonders! Let’s see some examples of what Microsoft Excel can do.

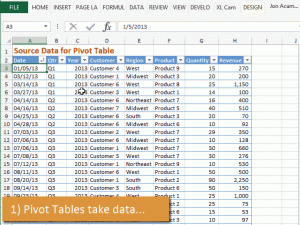
Pivot Tables
Pivot Tables

Basic Things that Microsoft Excel is great to use for are:

  • Creating Tables
  • Finding Duplicates
  • Eliminating Duplicates

Advanced Excel Techniques

  • Using Range Names
  • Formulas and Function like Vlookup, Text Functions, Date Functions
  • Pivot Tables
  • Pivot Charts
  • Macros to automate routine tasks
  • Sharing Worksheets and Workbooks
  • Protecting Worksheet, Workbook, individual Cells

Advanced Analysis Techniques and Data Analysis using Microsoft Excel:

Excel VLookup Sample


Are you using Excel to your advantage, or just using it as a basic calculator?

Cheers,
Vinai Prakash
Intellisoft Systems

Creating Management Dashboards in Microsoft Excel

Excel dashboard training Singapore

Today, Microsoft Excel has become extremely power tool for any data warrior. Whether you work in Sales, Marketing, Customer Service, Logistics, Accounts, Manufacturing, Finance or Administration, everyone must become an expert at using Microsoft Excel.

It is not sufficient to know Tables & Formulas in Excel. You must also know how to make sense of the data that you have.

Successful analysis of data, and presentation of data are vital skills for any office worker. Simple techniques to analyze data are to use Pivot Tables, Normal Data Ranges, and Tables.

Further, there are Advanced Data Analysis tools within Excel – like the Scenario Manager, Goal Seek, Solver, Conditional Formatting, Slicers etc. that make the job of data analysis much easier.

However, it is not sufficient to merely analyze the data. It is important for you to also present the data using the latest and best in-built techniques within Excel. Most of the people who come for Excel Dashboard Training, or the Data Analysis Training With Excel are not aware of these features.

Microsoft Excel Dashboard Training

Microsoft Excel Dashboard Training

When you create an Excel Report, which allows for the Report to become interactive, allows the management to play with the data, change the parameters, and see the data change, the graphs update dynamically, then such a report is called a Dashboard.

DIFFERENCE BETWEEN REPORTS AND DASHBOARDS

The key different between a Report and a Dashboard is that a Report can be static, long, and without any interactivity.

In contrast, a Dashboard is a dynamic report, Short, Fits a page usually, and allows the users to change several parameters on the fly to compare the data from the past year, quarter, and play what if dynamically.

Dynamic Checkbox Dashboard With Microsoft Excel

Dynamic Dashboard With Microsoft Excel – Learn to Do It Yourself!

Intellisoft Systems in Singapore conducts Public and Customized Classes for Creating Dashboards With Microsoft Excel. Many companies have opted for Corporate Training, where the content can be customized to suit your audience and participants, plus their level of expertise with Microsoft Excel.

For the dashboard training, the Excel version is not that important. You can use Microsoft Excel 2010, 2013 or Microsoft Excel 2016 for the Excel Dashboard Training.

Plus, the Dashboard training can be conducted in your country. Simply contact Intellisoft at +65-6250-3575 for the training details.

Cheers,
Intellisoft Systems Team, Fortune Centre, #10-08,
Singapore 188979

Recommended Training: Advanced Excel 2013Excel Dashboards MasterClassData Interpretation & AnalysisCustomized Corporate Training

Learn Excel VBA in Singapore

Excel VBA training at Intellisoft Singapore

Microsoft Excel is an extremely useful tool for any business analyst, finance executive, or power user. It helps to automate huge number of  calculations, with ease, and improves productivity.

Each Microsoft Excel version, be it Excel 2016 or Excel 2019, comes with a feature to Record Macros in Excel. This important feature provides us with with a technique to record a complex set of steps in Excel, and then run them over and over again, with a single click – it can save hours of work for a busy analyst.

To take the power of Excel Macros further, you can learn to edit the macros, and write your own macros, by hand. Excel provide you with this functionality, through the use of Visual Basic for Application or VBA in short. This is an extension of the Visual Basic Programming language, but customized for use with Microsoft Excel.

Most people are intimidated by programming, but Excel VBA programming is much simpler, and is easier to learn and apply.

Using VBA, you can Create Macros that do simple tasks, manipulate recorded properties and methods, and even do file operations like opening a CSV file, reading its contents, loading the data into a Excel file, append it to a database, adding sheets, creating pivot tables on the fly,  and much more.

Our 3 Day Excel VBA workshop in Singapore, is a very practical and useful training in Excel VBA. It guides perfect newbies into programming, using VBA and they begin to write simple to complex macros and VBA programs in a short period of time.

Most participants are delighted by this training. Here’s some recent feedback from the VBA Macro Training held in Singapore in 2016-2017:

* Good pace, very interactive, good examples that seemed applicable, class size is not too big, appropriate breaks, comfortable atmosphere with humor, and extra examples given.

* Enjoyed the training very much. I can efficiently apply it in my work in future.

Excel VBA (Macro) training at Intellisoft

* The coding part was fun, and learnt how VBA does wonders. It introduced Excel in a new dimension!

* The training will help me automate certain procedures and create creative solutions easily in Excel, using VBA.

* Examples we used were very interesting and relevant

The GREATEST STRENGTH of the VBA EXCEL Training is that it is Easy Enough for People with NO Programming Background.

Excel VBA Training Schedule

You can find more information about Excel 2016 VBA (Macro) and Excel 2019 VBA (Macro) schedules, or call us at +65 6250-3575 for Self Sponsored or Corporate Training on Excel VBA.

To Register online for the next Excel VBA Macro class, visit our Online Registration section.

Recommended Training: Excel 2016 VBA (Macro)Excel 2019 VBA (Macro)

Top 3 Features of Microsoft Excel You Must Know

top_excel_features_in_interviews

Microsoft Excel is heavily used in Banking, Sales, Finance, Marketing, Customer Service… you name it, it is used by people at operations level, supervisory level and management level for data entry, data analysis, tracking and reporting data.

No wonder in job interviews, Excel features heavily for such job roles.

The Top 3 features often asked in the Job Interviews are regarding Pivot Tables, VLookup Functions and Macros.

Do you know Pivot Tables in Excel?

Excel Pivot Table Training
Summarize Data Quickly With Microsoft Excel

Pivot tables are used to summarize multiple data rows in one or multiple sheets, and create a summary report. It is a fantastic tools that makes it much easier to view the data at a high level – by category, by division, by department, by area and by country etc… based on your data.

It is best if you master pivot tables, and its nuances, its options, its hidden features and become an expert at using Pivot tables.

Here are some articles I wrote about using Pivot Tables in Excel, and its advanced options of getting pivot data in summary sheets within Excel.

But you may want to attend the Advanced Excel classroom training, and even avail government grants, SkillsFuture, SDF funding etc. to get subsidized fees.

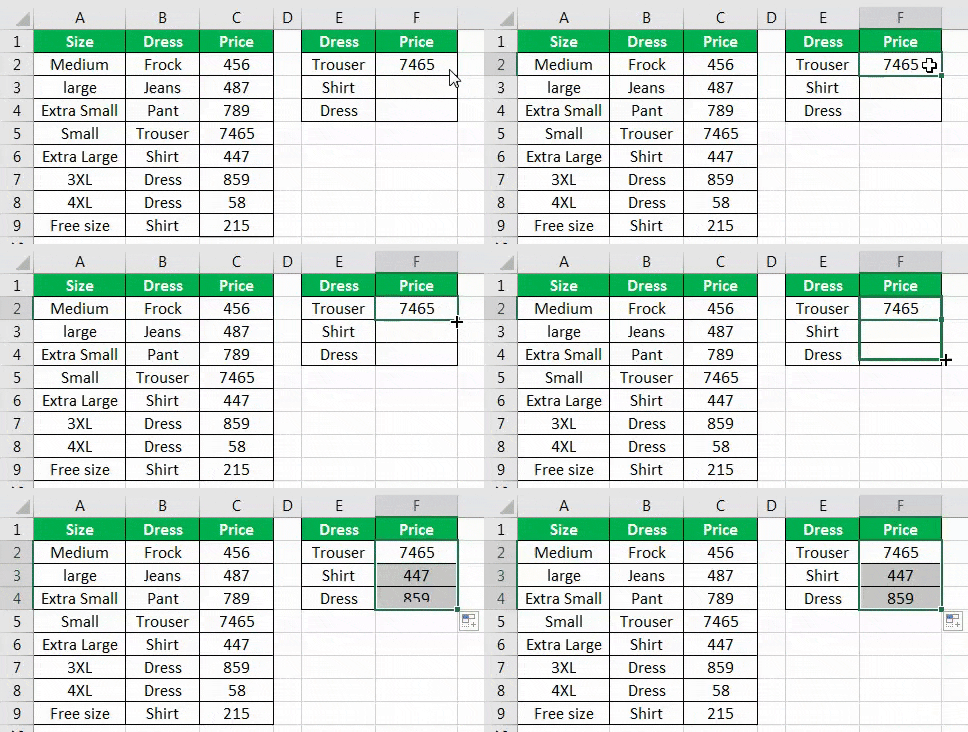
Do you know how to use the Vlookup Function in Excel?

Vlookup and Hlookup are 2 of the Lookup functions within Excel. They help to lookup prices of parts, employee names etc. from tables where you know the part number, employee number, IC number etc.

It is like looking up the meaning of a word in a dictionary. These are extremely powerful functions, and you must know them well.

Do note that there are couple of variations of the Lookup functions – Exact Match or Range Lookup (Approximate match). You must know what to use, and when to use which option.

Knowledge of VLookup is a  must for most industries using Excel, like the Banking & Finance industry.

Excel VLookup Sample

Again, at Intellisoft, we cover the Lookup Functions in the Advanced Excel and the Excel Dashboard MasterClass, where you learn how to create Management Reports and Dashboards using Microsoft Excel.

Do you know how to write Macros in Excel?

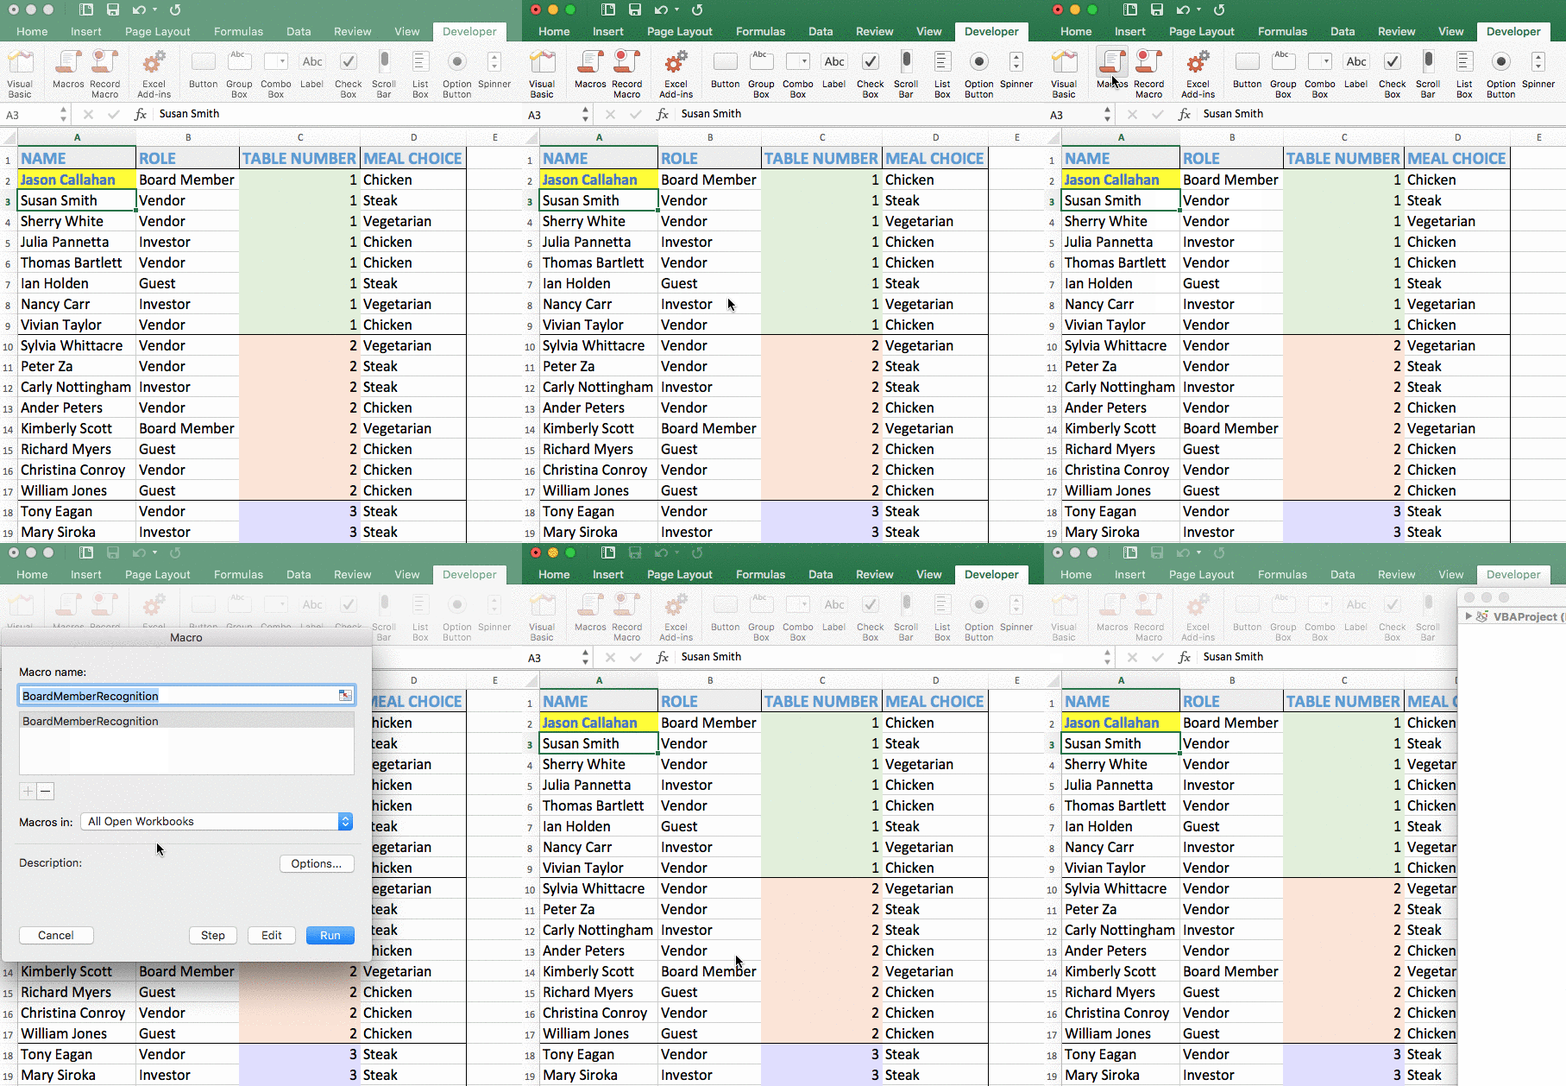
To save time in doing repeated steps, Microsoft introduced the Visual Basic for Applications programming language. IT is popularly called as VBA Macro programming. With VBA programming, you can extend Excel to create routines that can do the basic, mundane steps, quickly, and correctly, so you can spend more time with the more important stuff.

Excel macros are used in creating specific user forms, creating conditional logic, creating work flow within a n organization.

Excel Macro Sample
Excel Macro Sample

The end user can simple execute multiple steps without knowing how to do the intermediate steps, simply by clicking a button, which in turn can run a complex macro. It is so simple, and magical to use and execute macros within Excel.

You could use it to generate a profit and loss statement, a balance-sheet, a leave approval form, a cash flow statement, pivots and charts automatically, without doing multiple steps.

Read more about VBA Macro Programming here. And you can attend our 3 day VBA Macro programming training in Singapore.

Conclusion:

These are the most important and most used features of Microsoft Excel. Master these, and you will be very popular in your company, and you will improve your job prospects significantly by learning these 3 most important things in Excel.

Cheers,
Vinai Prakash,
Founder & Principal Trainer,
Intellisoft Systems

Free Tips, Tutorials & Training Grants Info

Learn from expert tips, tricks and resources for Excel, PowerPoint, Photoshop, Python, Power BI, Project Management, IT, Soft Skills & more with our Email Newsletter.
Plus get the latest news on Grants. Join Today!

Found What You Were
Looking For?

Just Tell us...

We're Here To Help You!