Have You Achieved Reporting Nirvana?

Achieved Reporting Nirvana with Intellisoft Singapore

Huh! What’s that?

Just see the image below & check where you see yourself – in Reporting Hell or Reporting Nirvana…
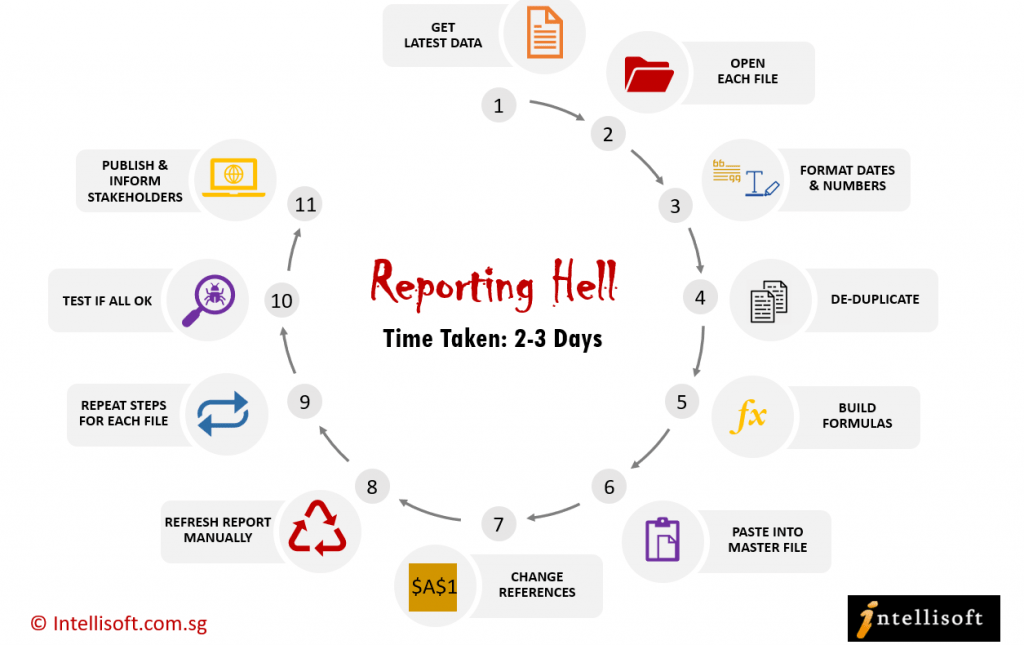
Reporting Hell
Manual Reporting Hell

If you are trapped in Reporting Hell, here’s your Typical Reporting Day

Step 1: Bring the latest data files each month. This could be in Text, CSV, Excel files.
Step 2: Open each file.

Step 3: Format Dates, Numbers & Text correctly in each data file.
Step 4: Remove Duplicates and check the data rows don’t have any junk data.

Step 5: Build Calculation Formulas to work out interim values.
Step 6: Once the data is in good shape, Copy and paste this into the Master Data File in Excel File.

Step 7: Change Data Source of Dropdowns, Pivots, Charts to include new data pasted in the master file.
Step 8: Refresh the Report manually for each pivot, chart or data source.

Step 9: Repeat the same steps for each data file. This is a laborious task of data cleaning, transforming & loading the data, called as the ETL process.
Step 10: Test to see if all well well, and that you did not miss anything.

Step 11: Publish the Report online & Inform the key stakeholders of the new report availability.
Step 12: Keep Fingers Crossed!

Typical Total Time Taken: 6 Hours to 3 Days at a minimum

It is extremely frustrating & time-consuming to do the same manual steps each month to load the data, clean it, transform it and update all reports manually.

Most data analysts spend almost 90% of their time in loading & cleaning the data. They hardly have any time left to analyze or visualize the data to help the management make better decisions. They are stuck in doing the mundane, routine things, which is a total waste of their time.

If you are in such a situation, you are living in Reporting Hell.

It is time to move to completely automated, dynamic reporting, that self-updates each day, week or month, and your users can consume the reports on any device, instantly. It is like living in Reporting Nirvana – a completely amazing and refreshing world, where you spend most time analyzing data productively.

Care to know more about Reporting Nirvana?

Reporting Nirvana: Typical Day

In Reporting Nirvana, here’s what your typical day looks like:
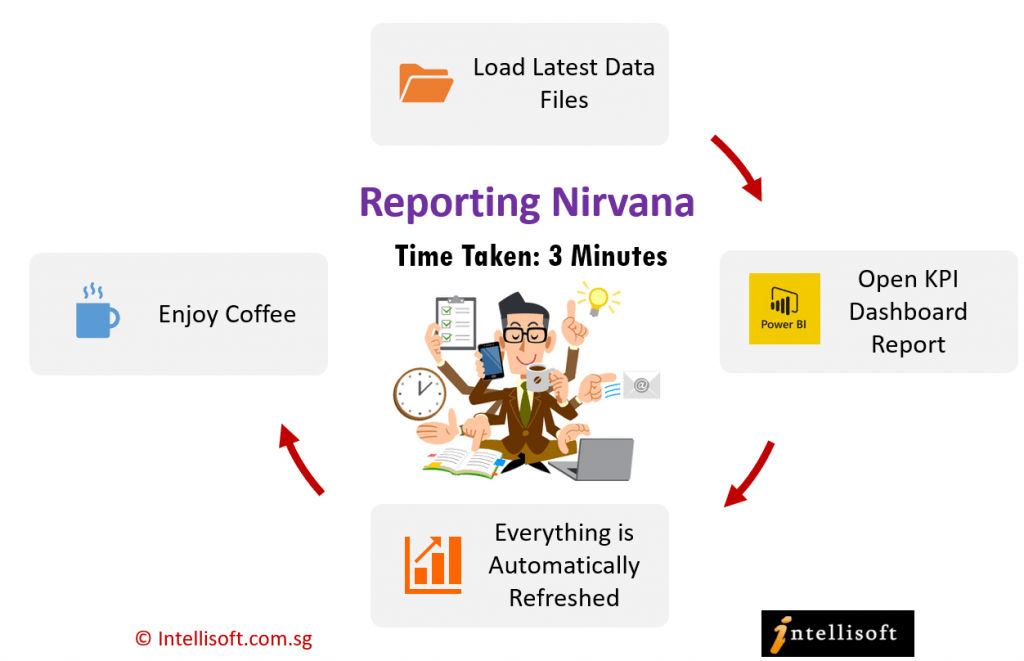
Reporting Nirvana With Power BI

Step 1: Bring the latest data files in whatever format.
Step 2: Open the KPI Dashboard Report, which automatically picks the latest data files

Step 3: Everything is automatically Refreshed
Step 4: Enjoy your coffee!

Typical Total Time Taken: 3 minutes to 15 minutes at a maximum.

Achieve Reporting Nirvana
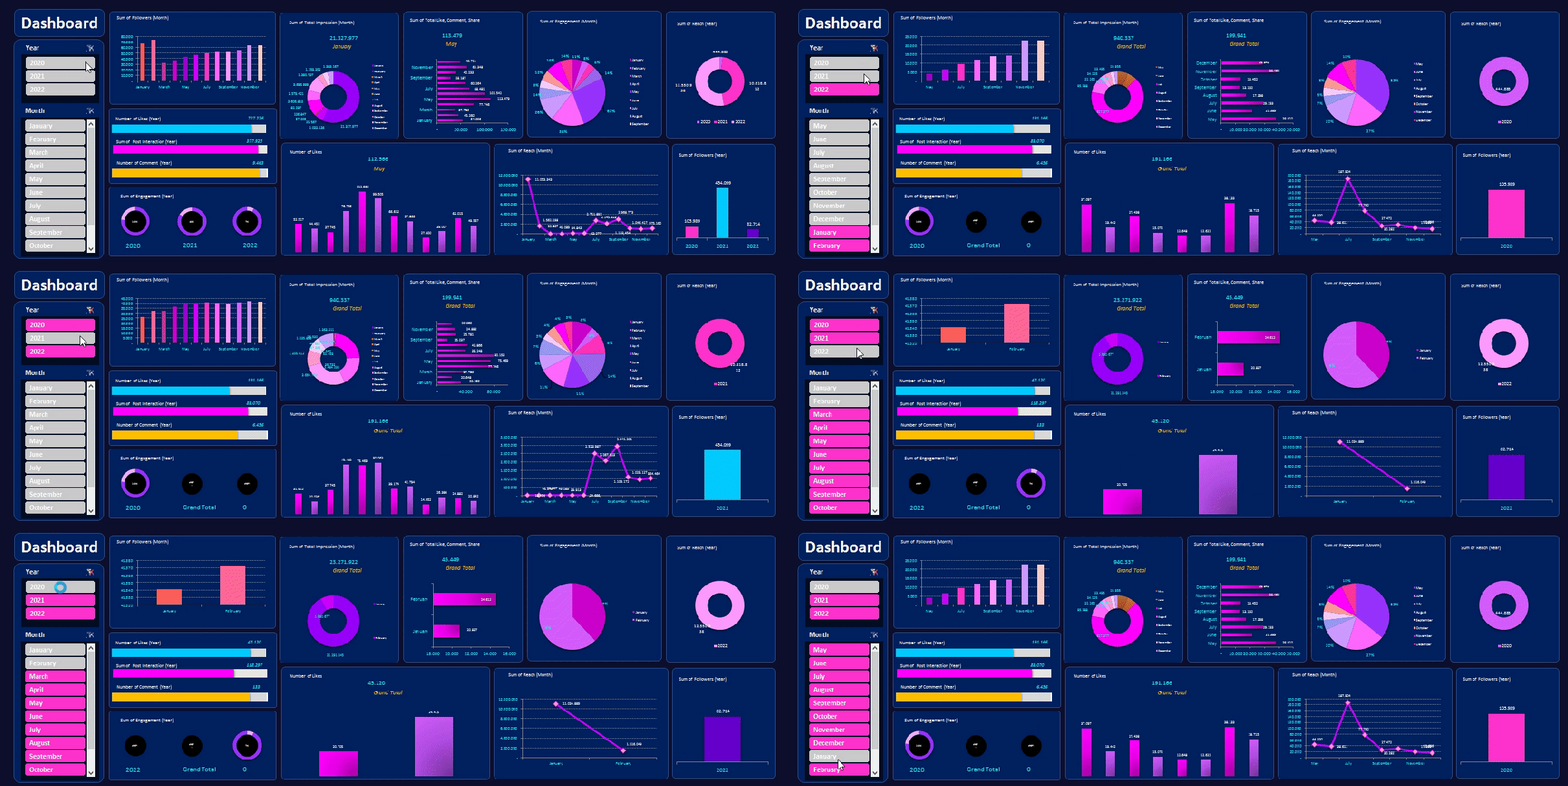
Dynamic Excel Dashboard Sample

It’s time to move to Reporting Nirvana With Microsoft Power BI automation tools – Power Query, Power Pivot, & Power BI or with Excel Dashboard Creation Techniques.  Imagine the amount of time you can save by doing the manual steps only once, and getting them executed each week & each month automatically, without having to do anything?

Attend the 2 Day Excel Dashboard MasterClass & the 2 Day PowerQuery, PowerPivot & PowerBI Training

Learn how you can achieve Reporting Nirvana, and spend your day doing smarter things, analyzing data and contributing to growing your company’s topline and bottom-line revenue! Contact us at training@intellisoft.com.sg

Cheers,
Vinai Prakash
Founder & Master Trainer: Intellisoft Systems

Microsoft Access – New Features

Using Templates in Access 2013

Using templates in Access 2013 is easy because, as with other Office programs, you can select a template right on the new document screen. Office 2013 in general boasts a lot of helpful templates to get you started on projects more quickly, and you’ll notice some interesting ones in Access 2013. There is a selection of table templates. You can take a pre-designed table with the required details. You can also start with design that somebody else has made for a particular type of data.

You can put documents together pretty quickly in the other programs and can customize on your own. An Access database can have so many elements that using something like an inventory database with reports already set up really made sense. These templates are usually adaptable enough that they make document creation easier in other applications, too. You can also try this by joining us.

Apps in Access 2013

Application in Microsoft Access 2013

Access 2013 users will notice a new emphasis on apps–as in building your own, in addition to using pre-made apps. You might group a couple of templates into an app or create an app dealing with customer data, for example. All this is made easy thanks to a user-friendly interface for general users.

So as far as apps go, you have the option to find one in the Office store, find a Web App Template, or customize your own Web Apps.

Want to learn all these features?

A Focus on the Web: Office 365, SharePoint 2013, and Access 2013

Focus on Web

Companies have been able to host their own database through SharePoint and SQL Server on their internal network.

A company that also subscribes to certain Office 365 plans with SharePoint can now host Access 2013 databases in the Cloud, set with public or private permissions.

A focus on the web is seen throughout all Office 2013 applications, with easy sharing to SkyDrive and social media.

SQL Server: Behind the Scenes of Access 2013

SQL Server

SQL Server has been improved in Access 2013, which translates to more opportunities as well as better speed and reliability.

Specifically, SQL Azure Databases will be available for some Office 365 business plans.

Because of all the SQL improvements, now you also have more options to manage connections in Access 2013. Permissions are more advanced in Access 2013. You will also be able to more readily incorporate advanced reporting tools such as Power View, Excel, and Crystal Reports into your Access 2013 database. These allow for greater analysis of data.

If you have any further questions or want to join Microsoft Access 2013 Training class then contact Intellisoft!!!

New Features in Excel

New Features of Excel

Do you know that Microsoft Excel comes with a plethora of new features. It is worth investing the time to learn exciting Excel features, and make the most of the latest and greatest spreadsheet software by Microsoft.

So what is so great about Microsoft Excel? Plenty. Our Master Trainer, Vinai Prakash take you to a tour of the new features in Excel.

Do You Know These Advanced Excel Tricks?

1. Quick Analysis Tool: The new Quick Analysis tool allows you to convert your data into a chart or a table in just two steps. Preview your data with conditional formatting, spark lines, or charts, and make your choice stick in just one click.

2. Instant Flash Fill: Flash Fill enters the rest of your data in one fell swoop, following the pattern it recognizes in your data.

3. Chart Recommendations: With Chart recommendations, Excel recommends the most suitable charts for your data. Get a quick peek to see how your data looks in the different charts, and then simply pick the one that shows the insights you want to present.

4. New Functions: There’s a whole slew of  new functions in the math and trigonometry, statistical, engineering, date and time, lookup and reference, logical, and text function categories.

5. Smart Pivot Tables: In Excel, When you create a PivotTable, Excel recommends several ways to summarize your data, and shows you a quick preview of the field layouts so you can pick the one that gives you the insights you’re looking for.

In the new Excel Data Model, you’ll be able to navigate to different levels more easily. Use Drill Down into a Pivot Table or Pivot Chart hierarchy to see granular levels of detail, and Drill Up to go to a higher level for “big picture” insights.

6. Improved Collaboration Tools: Working with other people on shared files in real time is a double-edged sword. While it’s useful to do this, you will face problems when two people try to change the same item at the same time. In Excel you can share and work collaboratively on files with others via SkyDrive using the Excel WebApp, and multiple people can work on the same file at the same time.

7. Standalone Pivot Charts: A PivotChart no longer has to be associated with a PivotTable. A standalone or de-coupled PivotChart lets you experience new ways to navigate to data details by using the new Drill Down, and Drill Up features. It’s also much easier to copy or move a de-coupled PivotChart.

Learn Excel in 2-3 Short Day Training: With so many new features, it is important that you learn these features, to improve your efficiency, productivity, and make use of these new  features. After all, what is the point of using the latest software if you do not use its latest and greatest features.

Learn to use Excel features like Vlookup, Macros, Pivot Tables, Pivot Charts, Tables, Advanced Functions and Formulas, Sharing, Collaboration, Removing Duplicates, and much more…

Do contact us at Intellisoft to attend our Basic Excel, or Advanced Excel training courses at our training centre, or have a Customized Corporate Training on Excel at your office.

We also provide WSQ Funded courses for Excel, which means that up to 90% of the course fee is funded by the Singapore Government. Terms & Conditions apply, so contact us for more information on training fees, Grants and customized solutions for your company.

Avoid Crowded Worksheets with this button

Learn the Hot Keys to Avoid Crowded Worksheet at Intellisoft Singapore

One simple way to reduce worksheet crowding is to rotate your column labels so that they read up, down, or vertically.

What are Advanced Excel Skills?

Add them to the Format toolbar, as follows:

  1. Choose Tools + Customize.
  2. Then Click the Commands tab.
  3. Under Categories, choose Format.
  4. Under Commands, find the Vertical Text button and drag it into place on your Formatting toolbar.
  5. Repeat Step 4 to drag the Rotate Text Up, Rotate Text Down, and, if needed Angle Text Upward and Angle Text Downward buttons to the Formatting toolbar

Now, whenever you want to angle or rotate text, just select the cell(s) and click the appropriate button. It will save you space, and make it easier to read and avoid eye strain.

Check this out if you are still Wondering Why learn advanced Excel?

Sparklines Microsoft Excel

Practical hands-on basic Excel training

In Microsoft Excel, some of the new features are sparklines and slicers, and improvements to PivotTables and other existing features, can help us to discover patterns or trends in the data. To get started with the features of Excel, first we will look at the details of the  Sparklines and slicers features of Excel.

Sparklines

Sparklines in Microsoft Excel Traiing
https://www.trainingint.com/advanced-excel-2016-certification

Sparklines are tiny charts that is used to fit in a cell to visually summarize trends beside the data.

Since sparklines show trends occupies less space, they are exclusively useful for dashboards and other places where we need to show a glimpse of the business in an simple practical visual format.

In the image to the left, the sparklines that appear in the Trend column lets us have a quick look of the performance of each department in the month of May.

Slicers

Excel Slicers Sample

Slicers are visual controls. They let us quickly refine data in a PivotTable in an interactive, automatic manner. If we insert a slicer, we can use buttons to quickly segment and refine the data to display appropriate results.

Not only that, when we apply more than one filter to the PivotTable, we no longer have to open a list to see which filters are enforced to the data. Rather, it is displayed on the screen in the slicer.

We can make slicers relate to the workbook formatting and easily reuse them in other PivotTables & PivotCharts.

If you would like to learn more about these new features of Microsoft Excel /  Office 365, or would like to attend the Advanced Microsoft Excel Training, do contact us at Intellisoft Systems.

If you have any further questions or want to join a training on how to use Sparklines, contact Intellisoft for Corporate Training on Excel or call at +65 6250-3575

Trainer: We have certified trainers who excel in imparting their knowledge and are very patient. Master Trainer Vinai teaches Advanced Excel Techniques, Dashboard Techniques using Excel, Data Interpretation and Analysis Training courses at Intellisoft.

He has  conducted over 700 live workshops, and trained over 5,000 students in over 18 countries, and regularly conducts Excel Workshops in Singapore, Malaysia, Indonesia, Australia, India, Dubai, Egypt, Zimbabwe, South Africa etc.

SEO Training in Singapore – 2 Full Days

SEO training at Intellisoft, Singapore

2 Days SEO Training in Singapore

When it comes to website design, most people take an active interest in the aesthetics, look and feel, font sizes, and content.  And once the website is completed, they just wait for traffic to show up automatically. They do not realise that websites are ranked by Google, and it is not difficult or impossible to get a higher rank in the Search Engines.

Getting a higher rank in the Search Engines is not only left to the Experts, the SEO Gurus, the Black Hat SEOs.

Now, you can learn to optimize your own website, and get a higher rank in the Search Engines too.

Intellisoft is organizing a 2 day, practical, hands on training on learning the tips, tricks, and trade secrets of optimizing websites – Doing SEO – on your own.

Join us for this 2 days workshop in singapore. Bring your own Website, and we will teach you the step by step procedure to optimize it for higher rankings in search engines.

In fact, Intellisoft Systems conducts Corporate and Public Training in Singapore for Internet Marketing. There are a whole series of course for Internet Marketers to increase customer Engagement using social media.

1. Pay per Click Advertising Workshop (PPC Training)

2. Email Marketing Training – Best & Cheapest Way to Market your products and Services.

3. Facebook Marketing for Businesses – A great way to network with clients, prospects, friends and generate a healthy return with minimal efforts.

Join today! and Learn to do the SEO of your own website, easily, without any hassles.

See you soon in class –
Cheers,
Intellisoft Systems – Providing Practical Training Tips, Tricks and Advice

Free Tips, Tutorials & Training Grants Info

Learn from expert tips, tricks and resources for Excel, PowerPoint, Photoshop, Python, Power BI, Project Management, IT, Soft Skills & more with our Email Newsletter.
Plus get the latest news on Grants. Join Today!

Found What You Were
Looking For?

Just Tell us...

We're Here To Help You!