From Data Frustration to Data Transformation: A Success Story

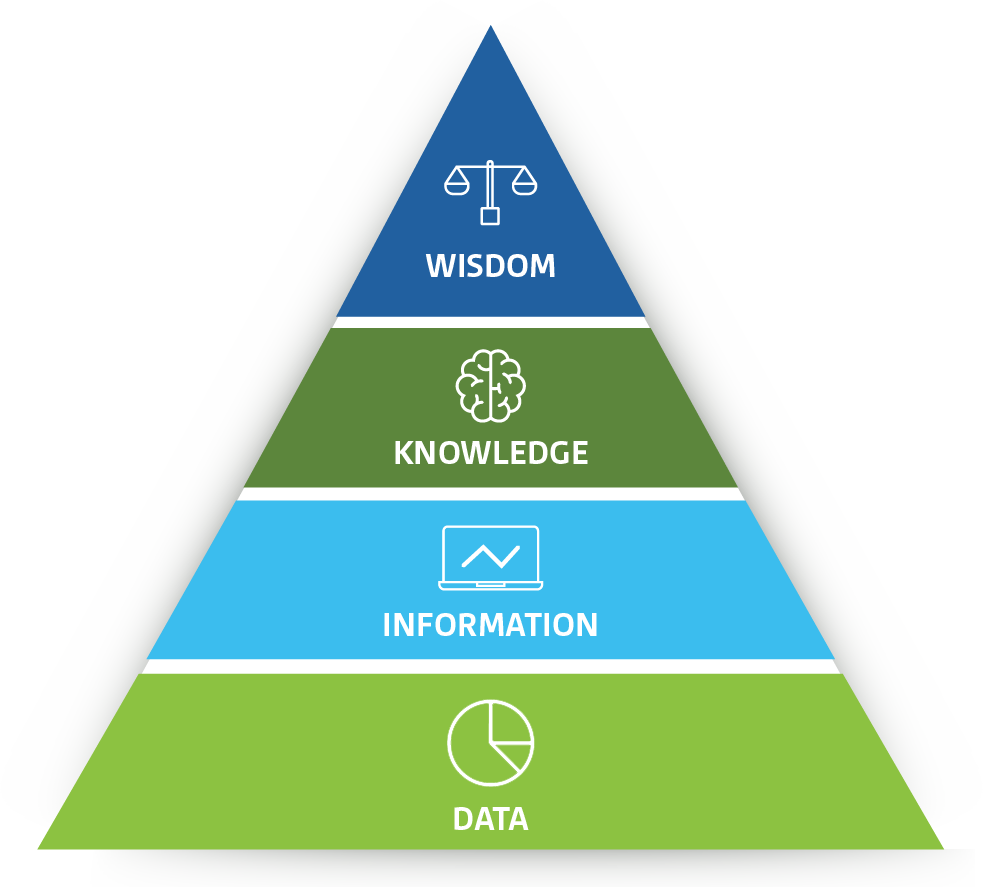
Learn to convert data into information into knowledge into wisdom at Intellisoft Systems Singapore

The Challenge of Having Too Much Data & Too Little Time

In today’s data-driven business landscape, the ability to extract meaningful insights from vast amounts of information is crucial. The amount of data that is coming is too fast, and there is hardly any time to analyze it.Learn to convert data into information into knowledge into wisdom at Intellisoft Systems Singapore

This challenge is faced by too many people… But there is light at the end of this black hole of data… See how our heroine, Amanda Lee managed to solve this challenge.

We take you on a captivating journey with Amanda, an employee who faced a daunting challenge: analyzing complex data from SAP.

Her determination, resourcefulness, and expertise in SQL, Excel, and Power BI led her to become a valued data analyst within her organization.

Let’s delve into the Case Study of Amanda and explore the transformative power of these tools, and how Amanda managed to survive the day and thrive…

The SAP Data Conundrum:

Amanda, a dedicated employee known for her analytical skills, was tasked by her manager to analyze data from SAP, the company’s backbone for managing vital business information.

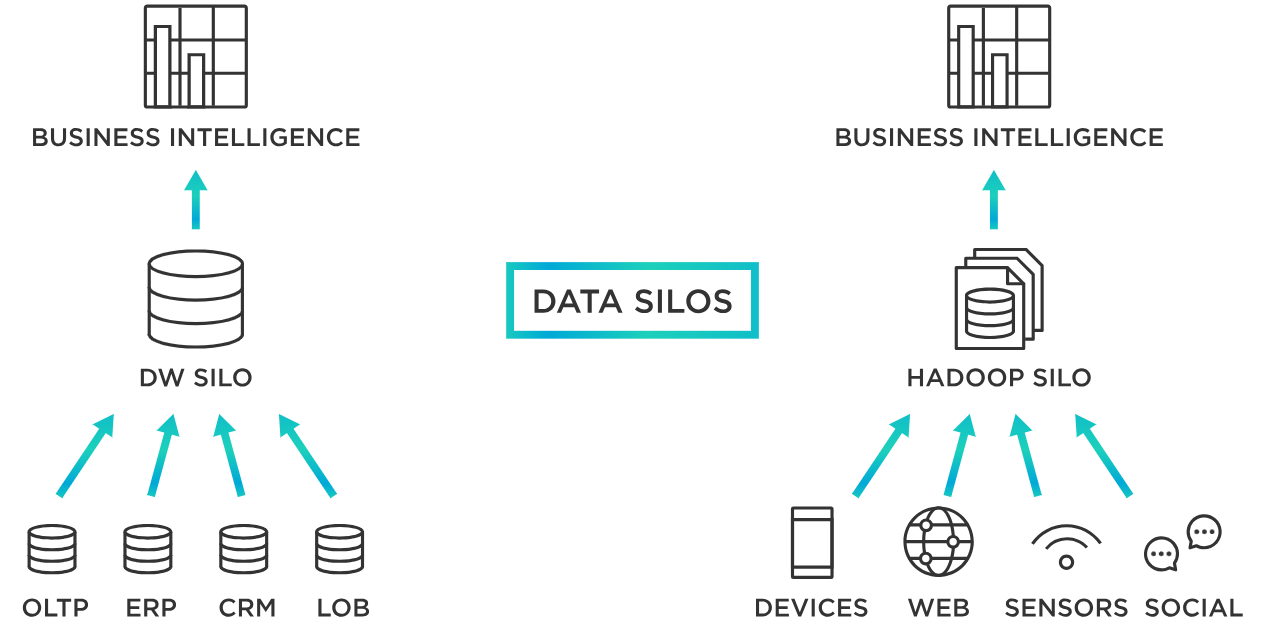
The data was available in multiple places in some standard reports, and some custom reports.Data in multiple silos can be combined with Power BI, SQL, Python. Learn how to do this at Intellisoft Courses in Singapore.

But the manager wanted a perfect report, and it was difficult to make sense of the whole, big picture from multiple sections.

So Amanda was tasked to take this challenge and make it work.

The challenge lay in finding a single report that provided a comprehensive overview of the required data. Undeterred, Amanda set out to conquer this data conundrum.

Exploring Standard Reports:

Amanda embarked on a meticulous exploration of SAP’s standard reports, hoping to find the perfect report or a solution.

She dedicated countless hours to examining various reports, seeking the elusive comprehensive data set.

However, despite her best efforts, none of the reports met the boss’s requirements.

Exporting and Excel Limitations:

Not one to give up easily, Amanda decided to export the data from SAP Reports into Excel, believing it would allow her to manage and analyze the information more effectively.

To her dismay, the exported data turned out to be massive, exceeding the limits of Excel’s capabilities. It became evident that relying solely on Excel would not suffice to solve this complex data puzzle.

Plus, loading multiple huge report files, and other Master data files at the same time caused her computer to crash often.

Excel and the Power of VLOOKUP:

Determined to find a solution, Amanda delved deeper into Excel’s functionalities and discovered the power of VLOOKUP.

She realized that by merging data from multiple sources, she could create a more comprehensive dataset. This process, however, proved to be laborious and error-prone, requiring significant time and effort to align the data properly.

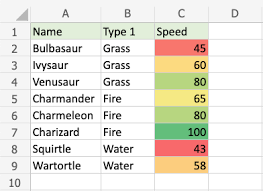
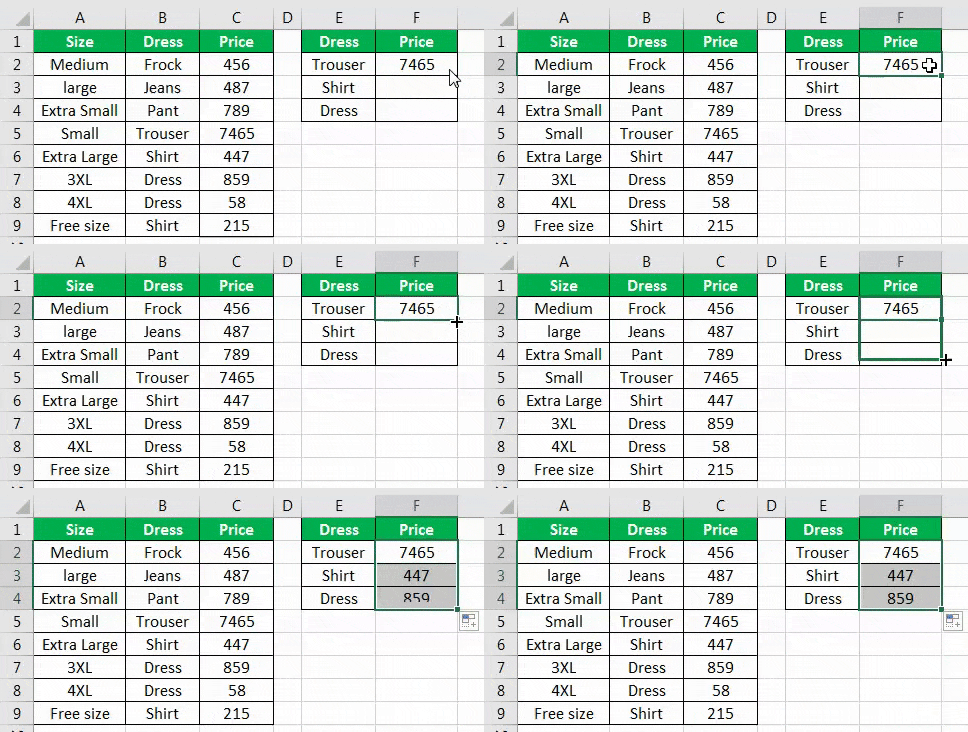
Excel VLookup Sample

Learning VLOOKUP is one thing, and applying it to lookup multiple codes & descriptions from multiple sheets and multiple Excel files was too cumbersome and slow.

Discovering SQL:

Driven by her desire for efficiency, Amanda set out on a quest to find a more robust solution. She began exploring the world of databases and stumbled upon SQL (Structured Query Language).

Recognizing its potential in handling large datasets and performing complex queries, Amanda dedicated to mastering SQL language.

Learn SQL to query any database quickly in Singapore
Introduction to SQL training in Singapore. Learn to query any database with SQL quickly in 2 days at Intellisoft

Learning SQL helped in picking the right data directly from transactional tables in SAP’s Oracle Database by joining several table and writing efficient SQL queries.

The SQL Solution:

Armed with SQL knowledge, Amanda devised a strategy to extract the required data needed from the corporate SAP database.

With a single SQL query, the query effortlessly pulled out the required information, bypassing the arduous process of manual data manipulation.

Amanda’s achievement in harnessing the power of SQL marked a significant turning point in her quest for analytical excellence.

Excel Dashboards and Visualizations:

With the right data finally at her disposal, Amanda exported it back into Excel, now equipped with the necessary insights.

She utilized Excel Dashboards to create various analyses and visualizations, bringing the data to life in a meaningful and impactful way.

The management was astounded by the depth of insights provided by these visualizations, realizing the untapped potential of data analysis.

Introducing Power BI:

The success achieved with Excel Dashboards paved the way for an even more remarkable transformation. Amanda was introduced to Power BI, a powerful business intelligence tool, by the Corporate HQ of the company.

She was spellbound by the dynamic, beautiful, amazing analysis capabilities of Power BI.

She began to migrate the entire solution from Excel to Power BI, creating interactive dashboards and reports that enabled the entire organization to access and explore the latest data analysis  effortlessly, from any device, without waiting for manual data refreshes and month end jobs to complete running.

Becoming the Data Analysis Expert:

Amanda’s expertise in SQL, Excel, and Power BI elevated her to a coveted position within the company.

She became the go-to analyst for senior management, constantly engaging in discussions and providing innovative solutions to analyze and visualize information for the leadership team.

Her journey from an individual contributor to a key player in shaping data-driven decisions exemplified the transformative power of mastering these tools.

Conclusion:

The story of Amanda’s journey from grappling with SAP’s data challenges to becoming an indispensable data analysis expert is a testament to the incredible possibilities offered by SQL, Excel, and Power BI.

By harnessing the power of these tools, individuals can unlock the true potential of data, transform their organizations, and become drivers of analytical excellence in the ever-evolving business landscape.

What Challenge Are You Facing?

Are you facing similar challenges? Or do you have other data challenges?

Do let us know. Our experienced training coordinators can assist you in understanding your data challenges and then guide you with an appropriate course to choose from.

This can help you get started in the right way, and not face the challenges that Amanda faced.

Cheers,

Vinai Prakash, Founder & Principal TrainerIntellisoft Systems

Recommended Reading:

Learn Excel Lookup Functions Easily

Some of the most popular Excel Lookup reference functions are VLOOKUP & HLOOKUP.

A newly added XLOOKUP is becoming very popular too. (XLOOKUP is currently only available in Office 365 versions). At Intellisoft, you can learn it by joining the XLOOKUP Training course in Singapore using Microsoft Office 365.

For the power users of Excel, the mastery of INDEX, MATCH & OFFSET can be considered vital, as these are considered the advanced lookup functions in Excel.

These functions will help you Analyze Data quickly. You should enrol in the data analysis and interpretation training class in Singapore.

But with the introduction of XLOOKUP, some of the jugglery created by mixing INDEX & MATCH combination is no longer required.

VLOOKUP Function of Excel

The most MUST HAVE Function ever. Even Excel gurus can’t live without it. I polled a group of Excel experts recently, asking if Excel’s VLOOKUP was overrated. I got a severe backlash for even mentioning it.

Almost everyone said that it is their GO TO function, an absolute must-have and that Excel won’t be that useable if this VLOOKUP function was taken away from Excel!

Most people swear by their VLOOKUP functions. It is their GO TO function when they want to lookup value of any type.

According to legend, VLOOKUP mastery is what separates the Pro Excel users from the Amateurs!

Vlookup is akin to using a dictionary. You know the word, and you want to find out the meaning. This dictionary is the range of cells that contain the lookup up value, and its associated value. The V in VLOOKUP stands for the dictionary being a vertical dictionary. So for a vertical lookup, you must use VLOOKUP function only.

=VLOOKUP(word, dictionary, column number of meaning, exact_match_ype)

The first column in the dictionary must contain the lookup up value, and the first row should be of the data. You should not include the headings in the dictionary table. The difficulty most people have with VLOOKUP is the last flag – the logical value of TRUE or FALSE (You can use 1 for True and 0 to indicate the False flag).

Once a matching value is found out, you will be able to get the return value based on the search. The error value of N/A will be generated if there is no exact match until the last row.

The mystery is created because to use VLOOKUP for an exact match, you have to specify the last optional flag, and set its value to a FALSE or a 0. By default, it is set to 1, which is useful for an approximate match type only. So for an exact match of a specific value, the last parameter is not really optional… it is mandatory.

VLOOKUP EXAMPLE:

There are a couple of major shortcomings in using VLookup function of Excel. First of all, the VLOOKUP is really a slow function. It is apparent when you do a lookup on a large list of 100,000 values or more. Secondly, VLOOKUP can only look up up a corresponding value from the columns on the right of the looked-up value. It can’t look to the left!

Make sure you master this Excel function really well.

HLOOKUP Function in Excel

An oft-forgotten cousin of VLOOKUP, this Horizontal Lookup and Reference function in Excel works in a similar way too. The only difference is that in this case, a lookup dictionary is a horizontal dictionary of columns, denoted by the H.

HLOOKUP is most used in range lookups, rather than exact matches, as columns are not the best suited for exact values, because of their limit of 16,000. Where a list can grow vertically to over a million records easily.

In the following formula, this lookup function searches for the closest match, especially when we are not searching for an exact match, but an approximate match. The dictionary is the table array and it is recommended that we use the absolute reference to lock the cells from moving.

=HLOOKUP(A5, $G$2:$K$100, 2)

Here the HLOOKUP will search for the exact or the next smallest value in the lookup table absolute range of $G$2 to $K$100, and return the second row. If you want the third row, you can change the 2 into a 3.

Both VLOOKUP & HLOOKUP return values from a single row or a single column.

Using the XLOOKUP Function in Excel

Did you know that new functions are added to Excel till today, and these are extremely useful functions making approximate matches as well as exact matches.

Finally, after years of backlash at Microsoft for creating the mess with the Match Type (True and False) in VLOOKUP, they got rid of it completely in the Excel XLOOKUP function.

And by default, XLOOKUP is set to do an exact match.

XLOOKUP requires a deeper understanding of the various scenarios. I’d recommend attending our formal ADvanced Excel Training to build a strong foundation in Excel. You can call us at 6250-3575 for more information of our courses and available enrollment dates for classroom training in Singapore.

This new XLOOKUP function of Excel is only available from Microsoft Office 365 users. It does not work on Excel 2016 or Excel 2019 versions.

Using INDEX Function in Excel

If you know the row number, you can find the value on that row or column cell directly.

INDEX can be used as an Array function also. Paired with MATCH, you can find any value on any row or column in a 2-dimensional array.

Index can help you to find the value on the row or the column of the specified number

How To Use Excel MATCH Function

When you want to find an exact match in an array and return the row number in the array, MATCH comes to your rescue. It is one up on VLOOKUP, which requires you to know the column you want to return. MATCH can find a match for a value that is lower, exactly equal or higher than the specified value.

Paired with INDEX, an INDEX & MATCH Function can manage to look up on the left or the right of any array of cells.

Master the OFFSET Function within Excel

To navigate your way in a two-dimensional array of rows and columns, you can use the OFFSET function in Excel. It can traverse any number of Rows or Columns, and get you the value.

How to use the offset function in Excel:

=OFFSET(Starting Cell, Row to move up or down, Columns to move left or right, Number of rows required to be returned, number of columns required to be returned)

I generally use OFFSET more than INDEX and MATCH combinations. Using one super-powerful OFFSET function is more straightforward.

Once you start using Offset in Excel, you wouldn’t want to use other lookup functions of Excel.

When Do I Use the INDIRECT Function of Excel?

The Excel INDIRECT function returns the reference specified by a text string. References are immediately evaluated to display their contents.

Use the INDIRECT function when you want to change the reference to a cell within a formula, without changing the formula itself.

=INDIRECT(A3)

The above Indirect function will check what is in cell A3. And A3 will have the cell reference to another cell. So if A3 contains B35, Excel will then read the value in cell B35.

Thus, we can get the value of the reference in cell A3. The reference is to cell B3, which may contain the value 45.

The INDIRECT can be very useful in creating custom management dashboards and reports.

What does the FORMULATEXT Function of Excel Do?

Displays the text of another formula. This helps to see all formulas next to their values and can be useful to spot mistakes and issues with formulas.

=FORMULATEXT(A3) will provide you with the formula in cell A3 as a Text Value.

This FormulaText function is useful to see the formula without having to go into Editing mode.

View this link for more information on how to get the Formula of another cell in Excel.

How to use ROWS Function of Excel

Displays the row number of a reference cell.

=ROWS(A1:B4)

Will return a 4. This is because there are 4 Rows in the given range.

How to Use the COLS Function in Microsoft Excel?

Displays the column number of a reference cell.

=COLS(A1:B4)

Will return a 2. This is because there are 2 Columns in the given range: A & B

Using the TRANSPOSE Function of Excel like a Pro

Converts rows into columns and columns into rows. Just like the Transpose feature in Paste Special, but done programmatically.

So if you use TRANSPOSE(A1:D3), you have selected 4 columns and 3 rows.

After the Transpose is completed, you will get an array reference of 3 Columns, and 4 Rows. The horizontal table would have flipped and will be visible vertically.

Pretty nice use of hanging values in rows into columns.

When Do I Use the UNIQUE Function of Excel?

The UNIQUE function of Excel generates a list of unique values that automatically spill down. An array function can be used to create data validation lists too. Available from Microsoft Office 365 onwards. This UNIQUE function is not available in Excel 2016 or Excel 2019.

Learning the Lookup Functions in Excel Quickly & Easily

As you can see, there are a lot of LOOKUP functions in Excel, and learning and mastering them takes time. But once you do master them, you can do wonders with your Excel skills.

It is worth the effort to learn the Excel Lookup Functions. Call Intellisoft at 6250-3575 or What’s App at +65 9066 9991 for Excel 365 Training that covers the key Lookup functions of Excel.

You will definitely enjoy it!

Cheers,

Vinai

Founder & Master Trainer at Intellisoft Systems in Singapore.

Advanced Excel Course in Singapore

Advanced Excel Course Content

Become Awesome With Advanced Excel Training Course

Advanced Excel course in Singapore is available at Intellisoft Systems.

Excel is a high-end spreadsheet software that is used in business. From simple data entry officers to analysts to managers, everyone loves to use Excel.

This is a higher end training, focusing on the Advanced Level of Microsoft Excel.

If you are new to Excel or have little experience in using Excel, you should first attend our Basic Excel Courses in Singapore. It is more suited to beginner and intermediate users, and will cover the basics of Microsoft Excel thoroughly.

You will then be able to do common tasks in Excel like write some simple functions in your daily work.

At the Advanced level, there are a range of courses available – ones that covers Pivot tables, Advanced Formulas of Excel, or focus on the Data analysis tools & capabilities within Excel to begin with.

Why Should I Learn Advanced Excel Skills?
Do You Know These Advanced Excel Tricks?

Intellisoft offers many advanced Excel training courses. T

o reach the Expert level, you must learn Excel VBA Programming, Excel Dashboarding Techniques, Using Power Query & Power Pivot add-ins of Excel, Advanced Formulas, Advanced Sorting, Advanced Filtering, and the ability to work with large data sets to handle big data.

At the Expert level, you will be looking to pick up business intelligence signals from the processing of data and using business analytics.

So you can see that Advanced Excel is really vast, and will help to take your skills to the next level. It may require you to take a few separate Excel courses to learn the full potential of the spreadsheet application that we all love to use – Excel.

There are numerous advantages of Excel. You must learn the advanced functions and features like pivot tables & macros early to make the most of it in your professional career or for your personal use .

What Advanced Features of Excel are covered in our Excel Training Course in Singapore?

The most important features of MS Excel are covered in depth. The course outlines these features like:

  • Advanced Excel Formulas,
  • Advanced Spreadsheet Functions,
  • Logical Functions
  • Date & Time Functions
  • Database Functions
  • Lookup Functions like VLOOKUP & HLOOKUP
  • Combine Formulas to Create More Powerful Functions
  • Pivot Tables for Summarizing Data Quickly,
  • Recording Basic Macros,
  • Conditional Formatting,
  • Custom Formatting
  • Creating & Using Range Names
  • Combining Data From Multiple Worksheets
  • Combining Data from Multiple Workbooks
  • Sharing Excel Files
  • Data Processing
  • Protecting Excel Workbooks
  • Creating Excel Charts & Customizing them
  • Creating & using Excel Templates
  • And numerous other useful Excel functions

    Do You Know These Advanced Excel Tricks?
    Do You Know These Advanced Excel Tricks?

Who are your Trainers For Advanced Excel Course?

All our trainers are certified Microsoft certified Trainers with a wealth of experience in using and teaching Excel. They are all ACTA certified and love to share their knowledge and application skills to make you an expert in Advanced Excel skills. We go the extra mile to help you master the key essential skills of Excel in a short time.

If you would like to learn from a Microsoft certified trainer with years of experience to learn what works well in the office or for your personal work, you should join our Advanced Microsoft Excel Courses at Intellisoft.

You can be from any type of industry, and you’ll still be able to learn numerous functions and formulas of Microsoft Excel and build your spreadsheet skills at your own pace. Whether you are a basic or advanced user, you will learn a ton of new techniques, shortcuts and tricks in Excel that will elevate your Excel skills to the next level.

Best VBA Course in Singapore
Excel VBA Macro Course in Singapore – Participants learning by writing  Macros themselves

What in Provided for the Advanced Excel Training at our Institute?

We provide you with

  • A laptop loaded with the correct version of Microsoft Excel for your use in our training room.
  • Advanced Excel Exercise Files will be provided too.
  • As part of the course materials provided, a detailed, step-by-step guidebook with Exercise files for Excel will be provided to each participant.
  • The included exercise files have cases from the business world as well as examples of how to use Excel for personal use. With this, your team will become expert excel users who can use the various tools, advanced excel functions and data management capabilities easily.

Pre-Requisites For The Training

In terms of pre-requisites for this Excel course, you don’t need a bachelor degree or any diploma.

Anyone with good PC skills, some previous experience in using Excel, and a keen interest in learning the wide range of advanced functionalities of Excel can join this advanced training workshop.

Excel Dashboard Training Participants
Excel Training Participants at Intellisoft

In a short period of just 2 days, you will be able to

  • use pivot tables,
  • formulas of excel,
  • advanced spreadsheet functions,
  • data analysis tools,
  • charting techniques,
  • conditional formatting,
  • Excel Reports
  • and much more.

You will be able to appreciate the full potential of Excel in everyday use at the office.

Whether you want to make simple or complex spreadsheets, you will have the skills. It does not matter which type of position or the type of industry you are targeting, Excel is used everywhere. So at the completion of this unit, you can call yourself an Advanced User of Excel, and you will have a certificate to prove it too.

Available Grants & Funding For Excel Training For Singaporeans & PRs

You can use SkillsFuture* or SDF Grants for company sponsored training courses where the course fees is partly sponsored by the Singapore government. The SSG Rules & Guidelines on eligibility apply.

With an affordable price, we can also arrange for corporate training for a group of participants at your company training rooms or you can attend the training at Intellisoft Training rooms too.

Our training facilities in the lab are top notch. We take care of of social distancing & government rules and regulations.

Intellisoft is considered the best Microsoft Excel training centre in Singapore.

Advanced Excel Course Content
Advanced Excel Course Training in Singapore

How To Join Advanced Excel Training Course in Singapore?

Prospective learners can contact our Training center at Fortune Centre and we can send you more precise information about the course. Request for a course brochure or Register for Advanced Excel training now.

You can then browse the outline of our Microsoft Excel Courses and pick the one that suits your needs the most. Our courses are short, practical and to the point. You will enjoy the training and become a better Excel user is no time.

Learn the most powerful spreadsheet program in the world… directly from the Microsoft Experts!

Join the Advanced Excel Course in Singapore at Intellisoft. We are waiting for you…

Cheers,
Vinai Prakash
Founder of Intellisoft Systems

How To Calculate Customer Engagement Using Social Media?

How To Calculate Customer Engagement Using Social Media?

The rising engagement of people in social media platforms have attracted all the brands towards social media. So, Brands have started to craft graphical story around the key brand value and offerings for better Customer Engagement using Social Media.

The challenge today is to find how engaged are your customers with your Social Media Pages. This needs to be measure & tracked to ensure enough ROI is being generated for the time & resources spent.

If you are a Digital Marketer, having a proper Strategy & Implementation in Digital Marketing is the only way to reach target audience. Also, to generate good ROI.

Let us discuss the social media engagement steps from strategy to Implementation that will improve the ROI & Customer Engagement.

  1. Set SMART Goals:

There’s no denying that social media can be a powerful tool, but too often companies caught up in producing a stream of content. But, they don’t think about the big picture.

Whether its corporate, marketing, branding or Customer relationship management, it will work better if the goals are shaped around the key business objective.

Leat to set SMART goals for Better Customer Engagement at Intellisoft
SMART goals for Better Customer Engagement in Social Media

Select several goals that are most important to your business and are feasible to achieve.

The goals can be:

  • Awareness
  • Customer Retention
  • Branding
  • Lead Generation
  • Promotion
  • Referral Traffic
  • Sales
  • Launch
  • Loyalty

By curating the goals you can easily think of themes, content brackets, visuals & platforms. If you think its limiting, its quiet opposite. In fact, it gives a clear understanding and vision of accomplishments.

Do check out our Insightful Article on the 10 Exciting Tips for Engaging on Instagram

  1. Analyze Your Social Media Marketing Strategy:

Once you have defined the big-picture, it is important to stack your efforts in right way. It is important to analyze how you allocate the content. This is to make sure the contents are in alignment with the goals and key business objectives.

Learn to Analyze the Customer Engagement Strategy at Intellisoft Singapore
Learn to Analyze the Social Media Marketing Strategy at Intellisoft Singapore

Curate a system to measure the social media content efforts to support your goals. First, create a basic spreadsheet of content, time and engagement. It can be filtered to analyze later.

Here are the few questions to start your analysis with:

  • What is my post frequency?
  • What topics do I post most frequently about?
  • Is my brand’s voice, personality and objective coming through my post?
  • What characterizes my post?
  1. Implement Your Game Plan:

Goals may be the backbone of the marketing program, but translating the to a powerful content will take you a long way. Think of each piece of content you share as a larger story your brand / company wants to communicate.

In fact, each content should have a clear theme, point of view and a take away for the consumer.

Learn to Implement your Marketing Strategy at Intellisoft Singapore
Learn to Implement your Social Media Marketing Strategy at Intellisoft Singapore

Here are some ideas of Implementation:

  • Post Regularly & Be active
  • Communicate Promotions, Offers and Services
  • Respond quick for customer engagement
  • Mix up types of contents
  • Show the usefulness and lifestyle
  1. Track & Measure ROI:

Looking closely at the implementation, the next step would be tracking of the engagement.

Learn to Track & Measure ROI with Insights at Intellisoft Singapore
Learn to Track & Measure ROI with Social Media Insights at Intellisoft Singapore

Track the insights & engagement to streamline the efforts better. You can easily track the following:

  • Time people are Viewing your post
  • Demographics of the people engaging
  • Tracking the Clicks to Conversion
  • Type of Contents that gets the more engagement. For instance – Inspirational Quotes, Texts, Videos, Images, GIF, Info-graphics

Track the content themes & decide frequency based on the engagement metrics. Alter the frequency, time  & Content Strategy based on the insights.

Qualitative content wins. Focus on the content that generate strong leads, keep in track of loyal consumers, a responses from star consumer, and add them to further posts.

This might be a little hard to keep in track but its valuable to capture them and add because ultimately not always number wins, but satisfaction & reviews do.

How To Calculate Customer Engagement using Social Media?

Here are some quick ways to calculate engagements:

  • Look for Virality in your Facebook page analytics. It shows the likes & shares for your better understanding too.
  • Instagram: Enable insights from settings & start to track insights in every post. Therefore, you arrive at a better understanding of the reach.
Learn to Calculate Customer Engagement With Insights at Intellisoft Singapore

All these are a just perspective ideas & guidelines. But, it is always good to master the skill for desire outcomes.

Intellisoft has carefully designed a highly insightful Digital Marketing Course to help you learn & master the Social Media platforms to get your Brand, a great value.

Learn how to improve the current marketing activities & get them to perform at their very best, therefore getting the maximum ROI from them.

Why wait? Join us today & master Digital Marketing starting from S$61.25*. You can claim that also from SkillsFuture.

Register Online now for the 2 days practical hands-on course to get the most out of Digital Platforms.

We are here to assist you if you have any more questions on the Course.

Feel free to call me at 9343-2080 or Email us to request brochure or any other queries.

Cheers,
Lavanya
Tel: 6250-3575  Whatsapp:  9343-2080  | corporate@intellisoft.com.sg

Like us on Facebook, Follow us on Instagram & LinkedIn for more updates on Courses & Grant!

P.S: Do check out the interesting Article on 5 Tips to Improve your Business Search-ability in Google

What is Your Next Step After Learning Excel?

What is Your Next Step after Learning Advanced Excel?

What is Your Next Step After Learning Excel?

Wondering what to pursue after learning Excel? Let us find the answer. Before that, let’s first read a quick short story.

Once upon a time, a very strong woodcutter asked for a job in a timber merchant. The pay was good and so were the working conditions. So, the woodcutter was determined to do his best.

His boss gave him an axe and showed him the area where he would work.

The first day, the woodcutter felled 18 trees.

“Congratulations,” the boss said. “Go on that way!”

Motivated by the boss words, the woodcutter tried harder the next day, but he could only bring down 15 trees. However, the third day he tried even harder, but he could only manage 10 trees. Day after day, he finished with fewer trees.

“I must be losing my strength,” the woodcutter thought. He went to the boss and apologized, saying that he is week and could not understand what was going on too.

“When was the last time you sharpened your axe?” the boss asked.

“Sharpen? But I’ve had no time to sharpen my axe. I have been so busy trying to cut trees….”

This story states that equipping yourself shouldn’t ceases & sharpening the tool set & keep you updated is the only way to a long term success.

Now, why are we reading to this story?

Let me jump to the point directly.

The world is fast paced. So, we need to have the required tools ready & sharp for use. 

It is almost impossible to find work that does not require some amount of Excel. Having the right skills for using and applying Excel for Simple or Advanced tasks is a must.

Microsoft Excel is one of the most valuable skill sets that can take you far!

However, most of you already know & use Microsoft Excel quite well. Really glad to know that. Still, sometimes even experienced Excel experts miss out on the best features of Excel that seem to be hidden.

Is it Sufficient to know Excel well to prove yourself in this competitive world?

Are you ready for the Future?

Learning never ceases and you should keep updating you to keep you in par with the emerging industry and not becoming outdated.

You should grab other Skill set after finishing Microsoft Advanced Excel to keep growing in the Job Industry.

AVAILABLE OPTIONS AFTER MASTERING MICROSOFT EXCEL

Let us discuss the variety of options available in front of you to pursue using the Advanced Microsoft Excel Skills that open you up to various career prospects in addition to career growth.

  1. ATTEND SQL WORKSHOP:

I am an Excel Expert. How do I get into Data Analysis?

I am an Analyst. But I always stand at the mercy of IT peers to query my Data!

Are you relating to these situations?

Let’s talk about the first step you can take to resolve this.

Analysis comes into play only after you have the set of relevant information in your hand that are clean as well.

When you yourself can query data from the relational Database system & reorganize, then certainly you are independent, and you can control your own productivity & efficiency.

Learning the right tool to collect & organize your data can be a savior. If you don’t know what is SQL & Why should you learn it, get yourself acquainted first.

Learn SQL to query any databse at Intellisoft Singapore
Learn SQL to query any Database at Intellisoft Singapore

SQL could be the priority as it is an easy to learn, straight-forward programming language. It is a simple but popular program for Data Management.

Administering, updating, maintaining, and manipulating the database is easy with SQL.

With SQL you can – retrieve, analyze and report information quickly and efficiently.

Wondering How to Learn SQL Fast?

Grab SQL Skills today to be an independent analyst otherwise make a new career as Data Analyst, Database Administrator, Data Scientists or even Data Architect at Intellisoft Singapore.

  1. Join Excel VBA (Macro) Course:

I am an Excel expert. Do I only get to learn the skills that are into Data Analysis?

Well definitely not. As we have already discussed Excel is a program that is used in all the fields in which the Data Analysis is just a new popular.

Excel could be enhanced with further skill sets and utilized in various tasks as well.

One such skill set that is highly useful for people into leadership, or managerial position to review the work or report, or even for someone who is into repeating the functions, formulas, or a set of same steps dozens of times every day.

There is a boon to such people – Macros in Excel.

You can write & record macros for simple to complex steps that you accomplish every day. In addition to that, Macro Code runs much faster and save a huge amount of time, which in turn will increase productivity.

After all, you don’t get bored of what you are doing every day.

Learn to Automate repeated Steps with VBA at Intellisoft Singapore

Looking to learn VBA (Macros) faster?

Join an Excel VBA (Macro) training at Intellisoft Singapore today to Learn practical ways to automate tasks & build a better workflow with VBA Macros and automation in your work.

  1. Data Interpretation & Analysis with Excel:

Data Analysis is a cool and exciting career to get into. When you already are aware of the Excel tool kit, now it’s time to learn the Techniques of Analyzing Data with Excel.

Data Analysis is a process of using logic & statistics to answer some of the business questions which consequently leads to decision-making.

You can learn to understand data and forecasting based on different criteria.

Charts & Modelling can be made using the Excel Features.

Correlation & regression techniques can be used to Analyze Data with different variables.

Data Interpretation & Analysis with Excel Training at Intellisoft Singapore

Above all, It is wise to grab the techniques of using the tool effectively, when you are an Excel Expert Already!

Wondering why you should learn Data Analysis? Check out the top 5 Cool Career Options that rely on Data Analysis

Also Join Intellisoft now to Grab Data Analysis Skills fast.

  1. Create Interactive Management Reports & Dashboards with Excel:

A Dashboard is the dynamic reporting technique used in business data reporting.

If you can present a huge amount of critical data in a Visually Appealing, Dynamic & Interactive Chart in Excel, apparently the decisions are made faster & you are the star of the boardroom already!

 Visually Appealing, Dynamic & Interactive Report in Excel
Visually Appealing, Dynamic & Interactive Report with Excel Dashboard at Intellisoft Singapore

Why wasting time, learn Excel Dashboard & report metrics that matter!

Well, I hope that you now have a clear idea of  What can you do after learning Advanced Microsoft Excel!

Take a breath! Make time out of your calendar to learn the essential skills that matter!

Best of Luck!

Cheers,
Lavanya
Like us on Facebook, Follow us on Instagram & LinkedIn for more updates on Courses & Grants.

What is Power BI: A Must-Have Skill For Analysts & Decision Makers

How to Use Power BI at Intellisoft Singapore classroom Training

What is Power BI: Intro to the Most Powerful Visualization Tool from Microsoft

The world runs with Technology but ruled by Data. Learning to process, manage, analyze and present data can lead to a flourishing Career Path.

Becoming a Data Analyst is the new cool. Data analysis as a career path has a bright future and a variety of options become available to keep moving ahead in your career.

The Data Analyst career path starts from grabbing the right Skills. While it needs a basic knowledge of SQL for querying Data and Python fundamentals, it a very much mandatory to upgrade yourself with the Key Skills like Advanced Microsoft Excel and Power BI.

We all have heard of SQL, Python and Microsoft Excel, but you may not be familiar with Microsoft Power BI.

Let’s find out What Power BI is, and How you can benefit from learning & using Power BI.

Why Microsoft PowerBI is Essential For Data Analysis?

Power BI is an intelligent software that is highly equipped to Analyze data and gain Insights quickly, without any fuss.

You can visualize data and create personalized reports & dashboards with KPIs that matter in your Business.

It is very popular among Data analysts because of the Speed, Accuracy, Consistency, and Security. You can set the report to refresh automatically, and inform the key stakeholders to view it on their i-Pads and Mobile phones.

The reports and insights can be collaborated effectively across all the different Software’s like Excel, SalesForce, SharePoint, SAP, Oracle Database, and even Microsoft Teams. This allows the whole team to get involved in Data Driven decision making.

Extensive Connections & Flexibility in Power BI

Microsoft Power BI has a growing Library of 100+ connectors that comes for Free and connects it to various Cloud based platforms like SQL, Salesforce and SharePoint.

In Power BI Desktop, users can:

What Power BI Can Do: Benefits of Microsoft Power BI
  • Connect to data
  • Transform and model the data
  • Create charts and graphs
  • Create reports and dashboards that are collections of visuals
  • Share reports with others using the Power BI service

What’s covered in Power BI Training?

This PowerBI MasterClass teaches the skills a business analyst needs to know in order to successfully use Power BI, Write DAX Measures and Use Power Query to Clean and Load data.

The course starts out first by highlighting the key Advanced Excel functionality useful for data analysis, and then moves to Power BI tools. We cover Microsoft Power Query, Power Pivot & Power BI – all built into the new Power BI Desktop Application.

This Practical, Hands-on workshop covers:

  1. Importing and creating relationships between tables of data.
  2. Understanding the optimal data structure to use in PowerBI.
  3. Writing basic Data Analysis eXpressions (DAX) formulas to extract business insights.
  4. Then writing more advanced DAX formulas that use the power of DAX to extract additional business insights from the data that are not immediately obvious (yet are inherently available).
  5. An introduction and overview of Power Query, how to use the tool to build data extraction and cleaning scripts, and why it is so great.
  6. Helping Excel professionals move from being a normal user in Excel to being a Power BI analyst, covering the differences between the tools and how to start using Power BI Dashboards effectively.

You Can Learn Power BI in a Classroom Setting

Unlike the other Basic computing software’s, Power BI should be learnt and mastered through a proper Training or a Master Class to make you understand the Power BI suite of products available from Microsoft, and be a Power Ninja in analyzing, visualizing & understanding Business Intelligence Reporting.

You should attend a Focused, instructor-led power packed program that make you

Focused Instructor Led Power BI Course in Singapore
  1. Understand Power Query & DAX, and how to apply it to your job.
  2. Achieve better and faster results than with existing Microsoft tools.
  3. Produce valuable KPI metrics for your business that never existed before.
  4. Learn best tips & tricks to solve complex problems & create stunning work.

Where can I Attend Power BI Course in Singapore?

Intellisoft Systems offers you an intensive Power BI Training in Singapore for 2 days.

Our expert approach in this classroom training course makes it accessible to become an Excel Pro.

At the end of the 2 days, you will be well on you way to becoming a Power BI, Power Pivot and Power Query Ninja!

What are the Pre-Requisites to Learning Power Query, Power Pivot & Power BI

You can easily learn Power BI f you have Basic knowledge of Excel, and can write simple formulas like SUM, IF, Nested IF, and:

Note: Anyone with a Database, BI, Programming, or similar experience are quite qualified to take this course, even if lacking in Excel experience.

Thousands of people like you have attended our training & started analyzing data, in Sales, Customer Service, Finance, Logistics, HR, Business & other functions in no time.

Gain Valuable Insights by Visualizing Data Quickly!

Whether you work in Banking, Marine & Offshore, Telecom, Networking, IT, Manufacturing, Services, Government or Healthcare, you must tap on the Best and Most Useful software for Data Analysis & Business Intelligence – POWER BI.

Go Beyond Excel Pivot Tables, Learn Power BI now!

Where: Intellisoft Systems, Singapore

You can Register Online or contact us to block seats for you while you get internal approvals.

Companies Can Claim SDF Funding for sponsoring their SG/PR staff. Individual Singaporean can use their SkillsFuture Funds to offset the course fees.

Why wait? Join Intellisoft now! Please call or Email me to reserve your spot on this Power Pivot and Power BI for Excel Training Program.

Like us on Facebook, Follow us on Instagram and Do Check out our LinkedIn for more updates on the Courses & Grants!

P.S: Looking for cool Careers? Check out the Top 5 Cool Careers in the Job market!

Article Written by Vinai Prakash, MBA, PMP, GAP, ACTA Certified

Additional Resources for Power BI

Training Courses

Data Analytics & Visualization with Power BI

Learn Microsoft Power BI Suite For Better Data Analysis & Reporting

Power BI Tips, Tricks & Video Tutorials

Power BI Tip #2: Reference Query Results in Another Query With Power Query [Video Tutorial]

Microsoft Power BI: Super Charge Your Data Analysis Process

Power BI Tip #6: Fixing The Vertical Axis in Power BI Visualisations

Power BI Tip #5: All About Slicer Controls in Power BI

Power BI Tip#4: Enter Data Into Power BI Quickly [Video]

Power BI Tip #3: Quick Formatting of Power BI Visuals

Free Tips, Tutorials & Training Grants Info

Learn from expert tips, tricks and resources for Excel, PowerPoint, Photoshop, Python, Power BI, Project Management, IT, Soft Skills & more with our Email Newsletter.
Plus get the latest news on Grants. Join Today!

Found What You Were
Looking For?

Just Tell us...

We're Here To Help You!