How To Calculate CPF Contribution With Excel [2024 Update]

How To Calculate CPF Contribution Using Microsoft Excel - Free Template in Excel

UPDATED FOR CPF CONTRIBUTION RATE CHANGES FROM THE YEAR 2024
How To Calculate CPF Contribution Using Microsoft Excel - Free Template in Excel
How To Calculate CPF Contribution Using Microsoft Excel – Free Template in Excel

Learn how to Calculate CPF contribution for Employees and Employers in Singapore by using Microsoft Excel. This covers Singapore Citizens and Singapore Permanent Residents SPRs.

If you want to join our Excel course in Singapore & improve your skills, we have multiple courses – Basic Excel for Analytics, Advanced Excel Courses in Singapore & VBA Macro Programming Courses.

Singapore CPF Rules
In Singapore, all salaried employees need to contribute 5-20% of their salary, depending on age to their Central Provident Fund or CPF. The employer contributes 7.5% to 17% of the salary to the CPF Fund, depending on the age of the worker.

The CPF contribution calculator for employers and employees can be done using Microsoft Excel.

CPF contribution calculator Excel File is available for download below.

Employee’s age
(years)
CPF Contribution Rates changes from 1 Jan 2022
(monthly wages > $750) Based on CPF Board
Total
(% of wage)
By employer
(% of wage)
By employee
(% of wage)
55 & below 37 17 20
Above 55 to 60 28 14 14
Above 60 to 65 18.5 10 8.5
Above 65 to 70 14 8 6
Above 70 12.5 7.5 5
Excel for HR Professionals

So payroll executives from Finance or HR professionals need to calculate the correct amount for the contribution to CPF, and provide the net salary to the employees who are Singapore Citizens or Singapore Permanent Residents (SPR). The employer also needs to know their total payroll expenses so as to know their Payroll Liability each month.

Calculating CPF Rates for Employees & Employers in Singapore
I have created a simple Excel spreadsheet to calculate the CPF Rates and Amounts in Singapore in this matter. If you wish to use this you can fill in your own Singapore Citizen & PR employee’s details, their age & basic pay, and the following is automatically calculated:
Learn Microsoft Excel 2019
Learn Advanced Excel 2019 @Intellisoft
  • Employee’s contribution,
  • The employer contribution,
  • Total CPF contributions,
  • Total payable to CPF,
  • Net salary to the employee
  • Gross Salary expense of the employer

The spreadsheet uses simple formulas that are already pre-programmed. So you can just begin to use this spreadsheet for your company.  It has been tested for CPF Contribution Rates in 2022 and beyond, and everything will work smoothly.

Increase in CPF contribution rates from 1 January 2022

  • The CPF contribution rates for employees aged above 55 to 70 have been increased.
  • The increase in the CPF contribution rates will be fully allocated to the employees’ Special Accounts to provide a bigger boost to their retirement income.
  • For those earning monthly wages of more than $500 to $750, the employee contribution rates will continue to be phased in.
  • There are no changes to the graduated contribution rates for first and second year Singapore Permanent Residents (SPRs). 

If you need any enhancements in calculating employee CPF & contributions payable for Payroll expenses for companies in Singapore or have any comments, do let us know. You can leave a comment below this post.

And of course, if you wish to learn how to create such excel spreadsheets, and use simple Microsoft Excel formulas and functions, you can also attend our Microsoft Excel Training classes in Singapore.

Advanced Excel 2019 Course (2 Days) – with SDF Funding

Basic / Intermediate Excel 2019 Training (2 Days) – With SDF Funding

Advanced Excel for HR Professionals (2 Day Classroom Training)

Hope you like this CPF Calculator Singapore Excel Template for calculating the CPF in Singapore. If you like it, I would appreciate it if you Like Us on Facebook, and leave a comment below!

Cheers,
Vinai Prakash, MBA, PMP, ITIL, GAP, Six Sigma
Master Trainer, Intellisoft Systems

Vinai teaches Advanced Excel Techniques, Dashboard Techniques using Excel, Data Interpretation and Analysis Training courses at Intellisoft. He has trained over 25,000 students in over 28 countries and regularly conducts Excel Workshops in Singapore, Malaysia, Indonesia, Australia, India, Dubai, Egypt, Zimbabwe, South Africa etc.

Contact Intellisoft to book a Certified Microsoft Excel Trainer for your Training needs.

DOWNLOAD EXCEL CPF CALCULATOR

Discover Lesser Known Features of Excel

Hidden features of Excel

Want to go beyond the common use of Excel and Explore its Extremely Useful but Lesser-Known Features of Microsoft Excel?

Microsoft Excel’s extensive features can help you to increases productivity and also saves time. Become proficient in Data Management & Business Analytics – Turn Data into Insights, Develop better tables & charts.

Lesser Known Features of Microsoft Excel

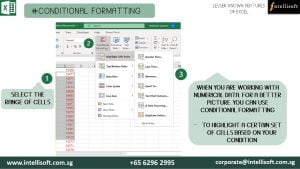
Conditional Formatting:

Apply formatting to cells automatically depending on the value of the cell. It is also a powerful feature, given that conditions can be based on any Excel formula. Conditional Formatting works by letting you set rules for how cells can be customized.

Conditional formatting makes it easy to highlight required cells or ranges of cells, emphasizing unusual values. In addition to that, it is used to visualize & analyze data in Excel by using data bars, color scales, and icon sets. Overall, it helps you to identify important data faster.

Learn Lesser Known Shortcuts of Excel at Intellisoft Singapore

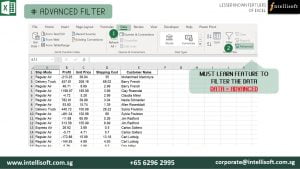
Advanced Filters:

This Advanced command works differently from the Filter command in several ways. It displays the Advanced Filter dialogue box instead of the Auto Filter menu. You can filter the data in place, or to a different location. You can also specify that you want to see unique items only.

All the duplicates are removed from the filtered list, with Advanced filter. The Data tab contains all the features of Advanced Filters. The advantage of using advanced filter is that you can see the filtered criteria in Excel cells. You can also easily add new filters by typing the values directly in the cells. Thus, it is absolute must learn feature.

Learn Advanced Filter for more Productivity at Intellisoft Singapore

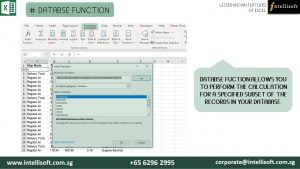
Database Functions:

Database functions is a Seldom used Gem in Microsoft Excel. With this, you can not only perform basic calculations but also use complex criteria, that allow you to perform the calculation for a specified subset of the records in your database.

These functions treat the entire set as a Database, just like a SQL Database.

Learn the Database Function at Intellisoft Singapore

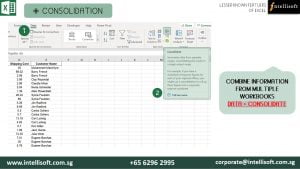
Consolidating Multiple Worksheet:

If you receive information in multiple sheets or workbooks that you want to summarize, the Consolidate command can help you pull data together onto one sheet. It allows you to combine information from multiple workbooks when you need them one place.

The Excel consolidate function lets you select data from its various locations and creates a table to summarize the information for you, automatically, painlessly.

Learn Consolidate Function at Intellisoft Singapore

Preventing others from Changing Master Data:

This feature allows you to prevent other users from accidentally or deliberately changing, moving, or deleting data in a worksheet. You can lock the cells on your Excel worksheet & then protect the sheet with a password.

With worksheet protection, you can make only certain parts of the sheet editable and users will not be able to modify data in any other region in the sheet.

You can lock the structure of your workbook by specifying a password.
Locking the workbook structure prevents other users from adding, moving, deleting, hiding, and renaming worksheets.

While Microsoft Excel is packed with gems, these are just a few advantages of learning Advanced Excel with us at Intellisoft. We’ll make you an expert in these lesser-known, but advanced features in Excel.

Using Pivot Table Data in Summary Sheets

Learn Pivot Tables Easily in Singapore at Intellisoft

Using GetPivotData in Excel To Get Pivot Values Instantly

Pivot tables from Microsoft are a great boon in Excel. Previously, getting IT departments to write custom reports used to take ages. And even if you could get a report written for your needs, by the time you got it, it was too late, or you wanted to look at information from another angle.

With Pivot tables, you can now create your own reports in no time. And you can slice and dice information pretty easily, with just a few clicks. If you haven’t used Pivots, this is a great reason to go for Advanced Excel Training.

However, even though Pivot tables are great, they are not the best tool  for presenting information for the senior management. There may be times when you want to pick up certain information from the pivot table, format it nicely, and present it with other summary figures.

To use the summarized data from the pivot table, but make it more presentable,  you can use an extremely useful function of Excel called the GetPivotData.

Enabling GetPivotData Button

It is very easy to get this function to work. This little gem is hidden right within the Pivot Toolbar. Just right click on the Pivot Toolbar, right at the end, and select customize. Pick Add/Remove Buttons.

Select GetPivotData button. This is a toggle button – click it once and it gets enabled, and another click disables it. You can see a slight change in the icon when it is enabled or disabled.

Once the button is highlighted, you can begin writing your formula. Start with a = sign in a black cell where you want a pivot table value. then point to any cell in the Pivot Table. Its value is captured in your formula.

As long as the data is available and visible in the Pivot table, you can move the data around from rows to columns or page fields, but it will still appear correctly in the presentation area.

Go ahead. Give it a try and make your data presentation summaries more dynamic and presentable. Any questions or comments, do let me know.

Hope you find this tiny tip useful…

If you want to learn more, you can join us for our Basic-Intermediate Excel Training course, or for the Advanced Excel Training in Singapore.

We offer classroom and online trainings for your benefit. The Advanced Excel training does cover Pivot Table reports and options in greater depth.

We’ll teach you how to create a pivot table from scratch, build it, design it, and use it to quickly summarize large amount of data in no time. 

And if you are wondering What to Do after Learning Advanced Excel, check out the other exciting courses.

Cheers,
Vinai Prakash
Founder & Editor of Microsoft Excel Tips Blog at Intellisoft Systems in Singapore

P.S: Have you checked out the 5 Cool Career Options in Data Analysis?

Do You Use These Advanced Features in Microsoft Excel?

Advanced Excel training at Intellisoft
Practical hands-on advanced excel training at Intellisoft

Most people hardly use the huge number of features available in Microsoft Excel. Many are just using Excel as a calculator. This is a gross under use of Excel’s vast potential and feature rich functionality.

Do a quick check, and see if you use these advanced features of Microsoft Excel in your day to day work.

Some of the common things that can be done easily with Excel are:

  1. Finding the Top 10 Customers or Finding the Bottom 10 Performers in the organization
  2. Highlight values that are above or below a certain threshold – like all sales above $25,000 to be highlighted
  3. Sort the values in Ascending, Descending or any customized order – like sorting in order of Manufacturing, Accounts, Sales departments.
  4. Give Names to Range of Cells, and then use them in formulas for easy referencing and decoding
  5. Exploit Pivot Tables to Summarize the data and slice & dice it in any way – finding sales by product groups, or calculating productivity by department
  6. Write Macros to automate routine things that save you a huge amount of time – example creating pivots, charts, tables, and doing complex calculations automatically.
  7. Use advanced filtering conditions, and be able to filter data using multiple different criteria
  8. Create fantastic charts that portray the given business situation perfectly. There are over 50 different types of charts to choose from, and each has its edge, advantages and a reason.
  9. Create management dashboard that are dynamic, and provide a complete snapshot of the key business KPIs in the company – change the chart values at the click of a checkbox or change in a drop-down value
  10. Use Excel’s advanced What-If analysis to do projections for future, forecasting, trend analysis etc. with ease
  11. Use Lookup tables to find any value or corresponding value from a table using advanced functions and formulas

This is just the tip of the iceberg. Microsoft Excel is really extremely powerful. Each version of Microsoft Excel – be it Excel 2007, or Excel 2010 or Excel 2013 adds more and more features to the already powerful dynamite of a package.

At Intellisoft, we teach people how to leverage the maximum power out of Microsoft Excel in short training courses. Some of the popular courses are:

We have a number of Public Classes each month, and we also provided In-House Training to your staff and team at your office, if you have a group of 10+ people, and have a room to hold the training.

So what are you waiting for? If you would like to learn any one or more of such useful features of Microsoft Excel, come for a short Excel Training at Intellisoft.

Go ahead, equip your team with the right skills. Get everyone on board to learn the basic and advanced features of Microsoft Excel, and Be Awesome in Excel!

Email to training@intellisoft.com.sg or call +65-6250-3575 for the next available schedule of Microsoft Excel Training in Singapore.

We are located at Fortune Centre, in Singapore! Location Map of Intellisoft

Cheers,
Vinai Prakash, PMP, ITIL, Six Sigma, GAP,
Master Trainer

Creating Management Dashboards in Microsoft Excel

Excel dashboard training Singapore

Today, Microsoft Excel has become extremely power tool for any data warrior. Whether you work in Sales, Marketing, Customer Service, Logistics, Accounts, Manufacturing, Finance or Administration, everyone must become an expert at using Microsoft Excel.

It is not sufficient to know Tables & Formulas in Excel. You must also know how to make sense of the data that you have.

Successful analysis of data, and presentation of data are vital skills for any office worker. Simple techniques to analyze data are to use Pivot Tables, Normal Data Ranges, and Tables.

Further, there are Advanced Data Analysis tools within Excel – like the Scenario Manager, Goal Seek, Solver, Conditional Formatting, Slicers etc. that make the job of data analysis much easier.

However, it is not sufficient to merely analyze the data. It is important for you to also present the data using the latest and best in-built techniques within Excel. Most of the people who come for Excel Dashboard Training, or the Data Analysis Training With Excel are not aware of these features.

Microsoft Excel Dashboard Training

Microsoft Excel Dashboard Training

When you create an Excel Report, which allows for the Report to become interactive, allows the management to play with the data, change the parameters, and see the data change, the graphs update dynamically, then such a report is called a Dashboard.

DIFFERENCE BETWEEN REPORTS AND DASHBOARDS

The key different between a Report and a Dashboard is that a Report can be static, long, and without any interactivity.

In contrast, a Dashboard is a dynamic report, Short, Fits a page usually, and allows the users to change several parameters on the fly to compare the data from the past year, quarter, and play what if dynamically.

Dynamic Checkbox Dashboard With Microsoft Excel

Dynamic Dashboard With Microsoft Excel – Learn to Do It Yourself!

Intellisoft Systems in Singapore conducts Public and Customized Classes for Creating Dashboards With Microsoft Excel. Many companies have opted for Corporate Training, where the content can be customized to suit your audience and participants, plus their level of expertise with Microsoft Excel.

For the dashboard training, the Excel version is not that important. You can use Microsoft Excel 2010, 2013 or Microsoft Excel 2016 for the Excel Dashboard Training.

Plus, the Dashboard training can be conducted in your country. Simply contact Intellisoft at +65-6250-3575 for the training details.

Cheers,
Intellisoft Systems Team, Fortune Centre, #10-08,
Singapore 188979

Recommended Training: Advanced Excel 2013Excel Dashboards MasterClassData Interpretation & AnalysisCustomized Corporate Training

Free Tips, Tutorials & Training Grants Info

Learn from expert tips, tricks and resources for Excel, PowerPoint, Photoshop, Python, Power BI, Project Management, IT, Soft Skills & more with our Email Newsletter.
Plus get the latest news on Grants. Join Today!

Found What You Were
Looking For?

Just Tell us...

We're Here To Help You!