Advanced Power BI MasterClass

Visualization using Advanced Power BI Tips & Tricks

Visualization using Advanced Power BI Tips & Tricks

Unlock the full potential of Power BI with our Advanced Power BI course!

Dive deep into

  • Advanced DAX measures,
  • Explore sophisticated use cases for Power Query, and
  • Master data visualization using advanced settings.

Learn to implement row-level security, keep your data models optimized, and import custom visuals.

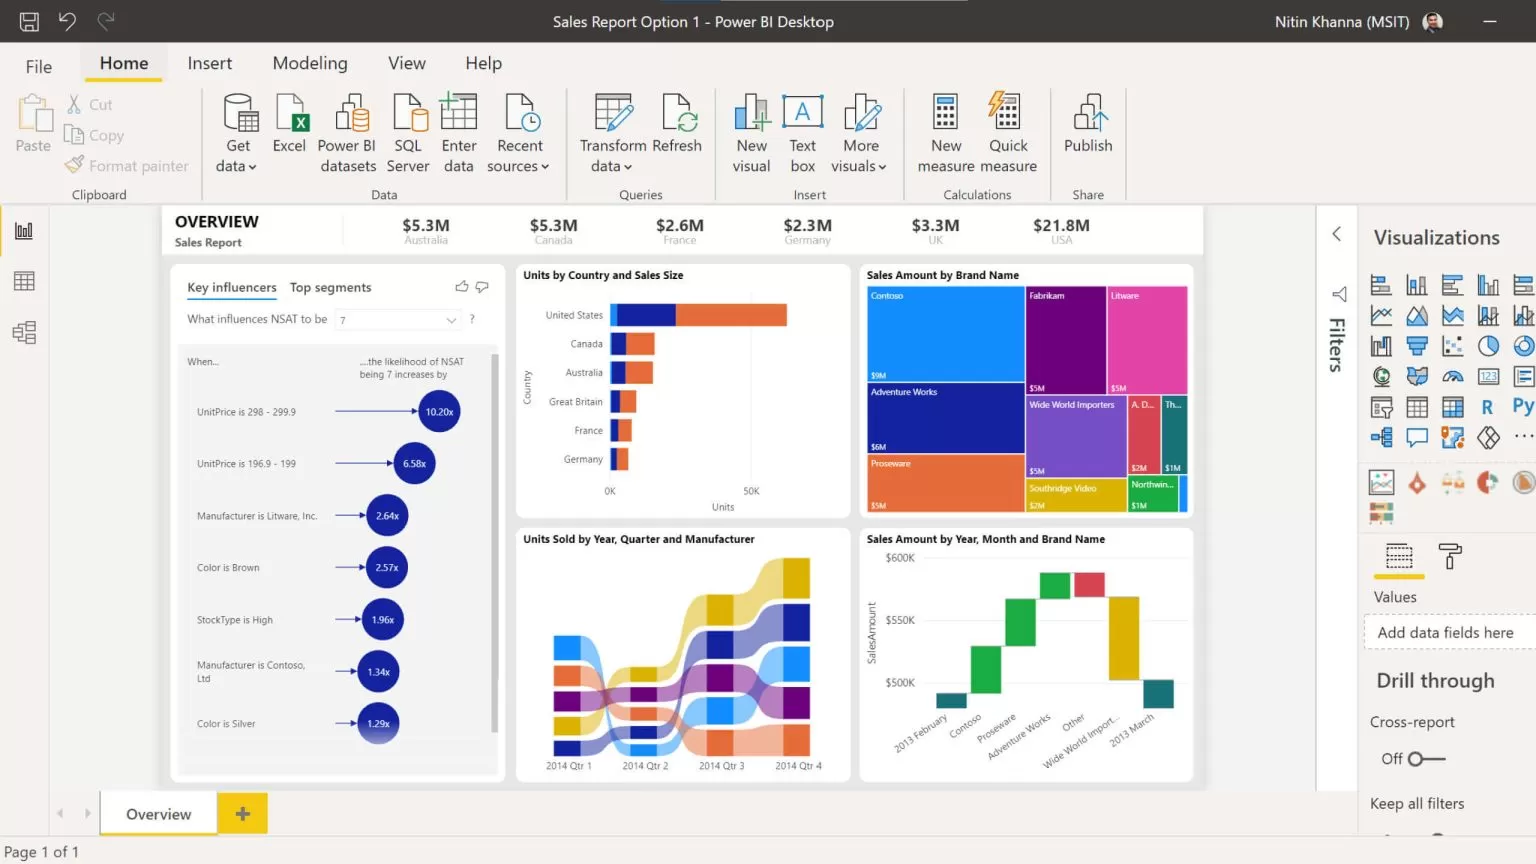
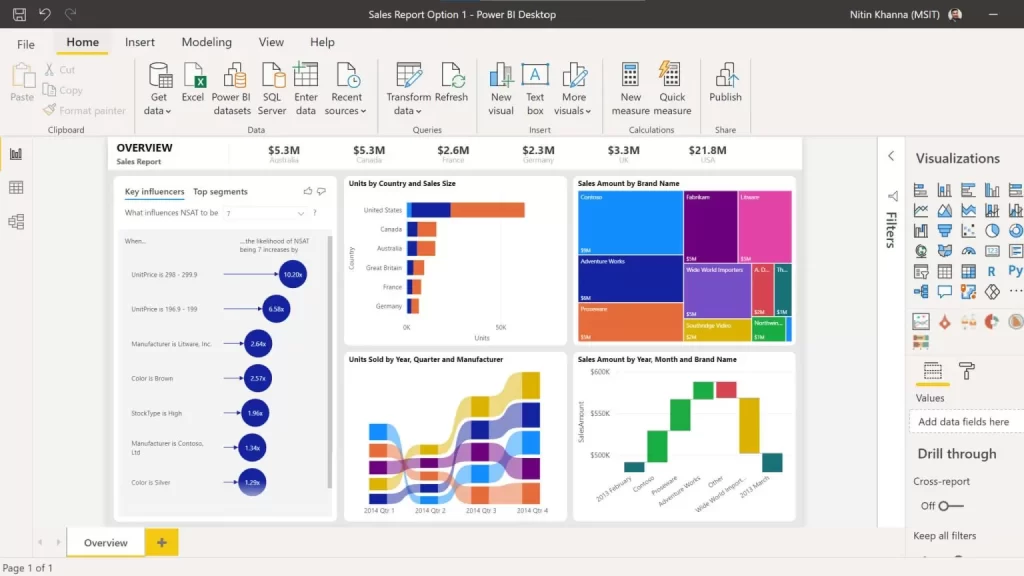
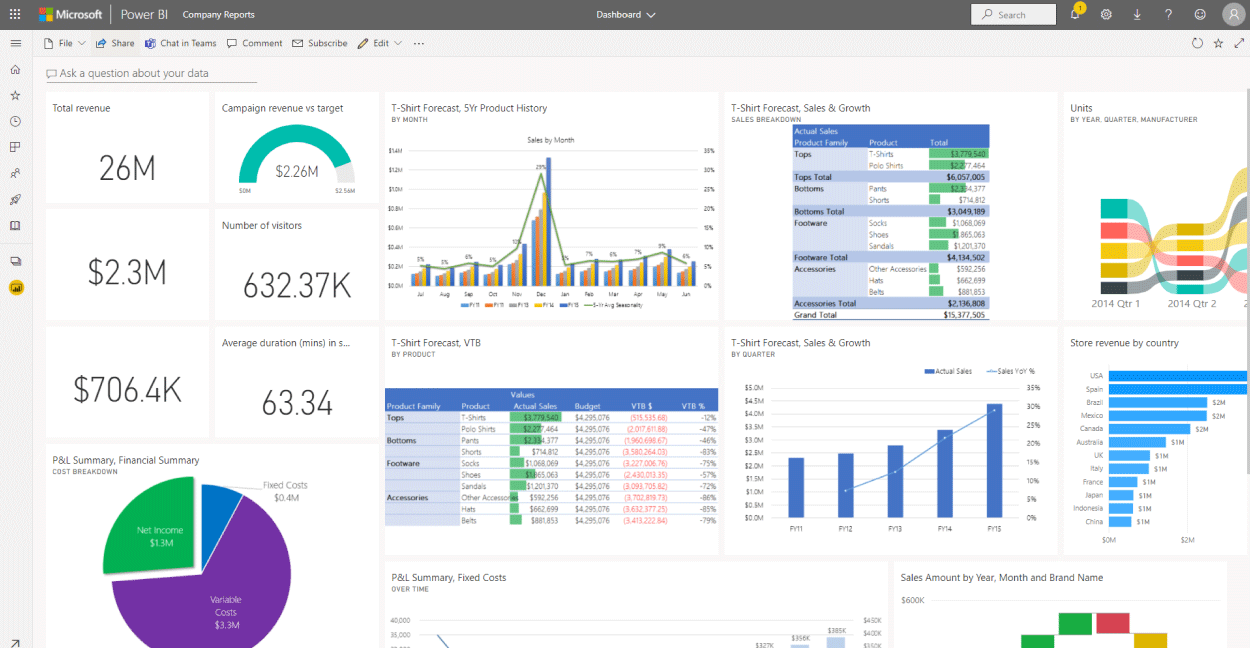
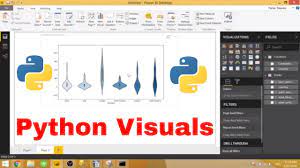
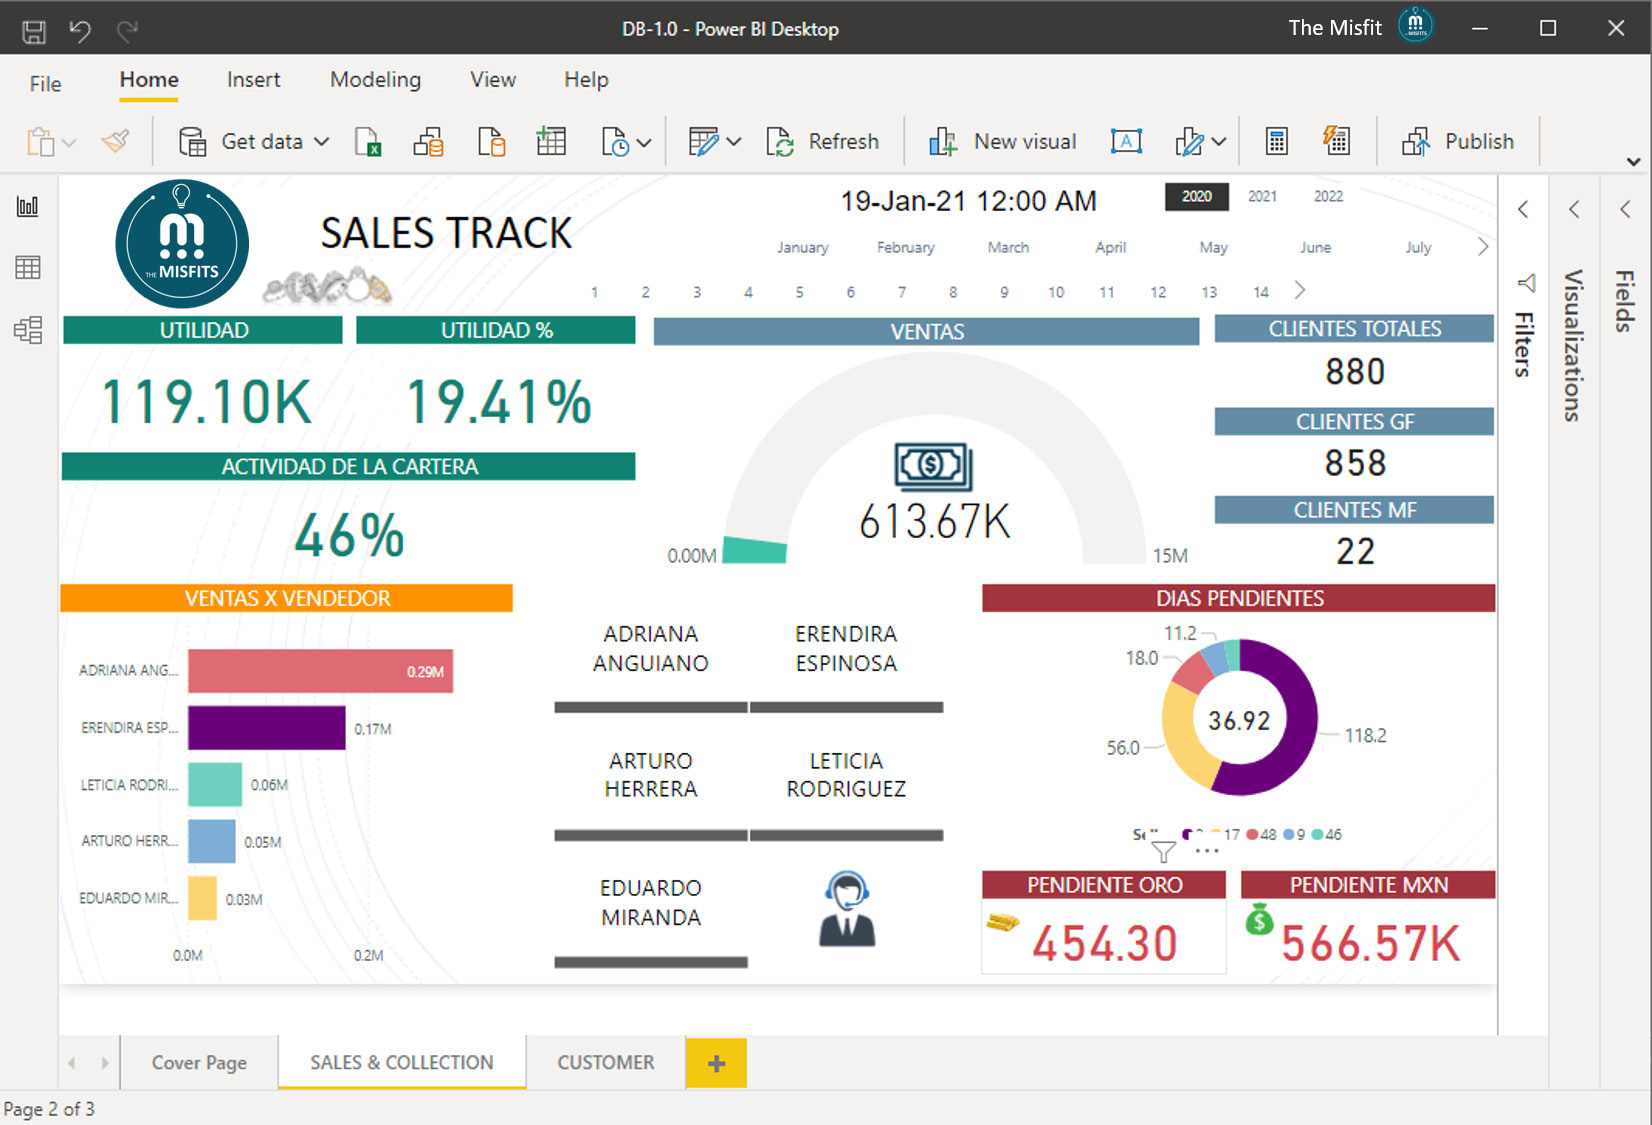
Enhance your reports with Python or R visuals, and leverage new KPI cards, Gauges, and more to create Stellar Dashboards for your management.Add Python Visualizations and Scripts in Power BI

This comprehensive two-day Advanced Power BI course in Singapore is designed for those who already know the basics of Power BI and are ready to elevate their skills to the next level.

Learn From Power BI Experts

Led by Power BI Guru Vinai Prakash, with over 35 years of experience in data analysis and business intelligence, this course promises hands-on, practical learning to empower you with advanced skills.

This is a very practical, and hands-on course on Power BI that will transform your Data Analysis skills and make you a PRO in using Advanced Power BI Features

  • Master advanced DAX measures for more powerful data analysis.
  • Explore advanced use cases and techniques in Power Query.
  • Learn data visualization best practices and advanced settings.
  • Implement row-level security to protect your data.
  • Optimize your data models to keep them small and efficient.
  • Import and use custom visuals to enhance your reports.
  • Create Python or R visuals for more dynamic data presentations.
  • Utilize new KPI cards, gauges, and other visuals to add value.
  • Understand and apply AI features, Quick Measures, and Advanced Time Intelligence Comparisons.

Master Time Intelligence Function in Power BI Advanced Course at Intellisoft Singapore.

Go To Top

This course is perfect for:

  • Business analysts and data professionals who have a basic understanding of Power BI.
  • Professionals looking to enhance their data visualization and analysis skills.
  • Individuals seeking to implement advanced Power BI features in their work.
  • Anyone interested in taking their Power BI knowledge to an intermediate or advanced level.

Best Advanced Power BI dashboard Course in Singapore

Go To Top

ADVANCED POWER BI – COURSE OUTLINE

Section 1: Data analytics With Power BI

  • Understanding data analytics
  • Explore Roles in data Analysis
  • Key Tasks for a data analyst
  • Introduction to Power BI Desktop Advanced Features
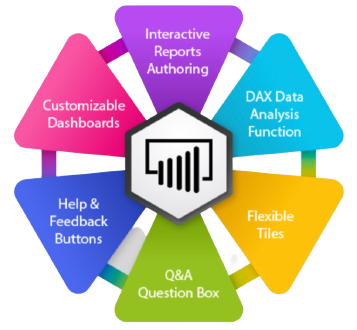
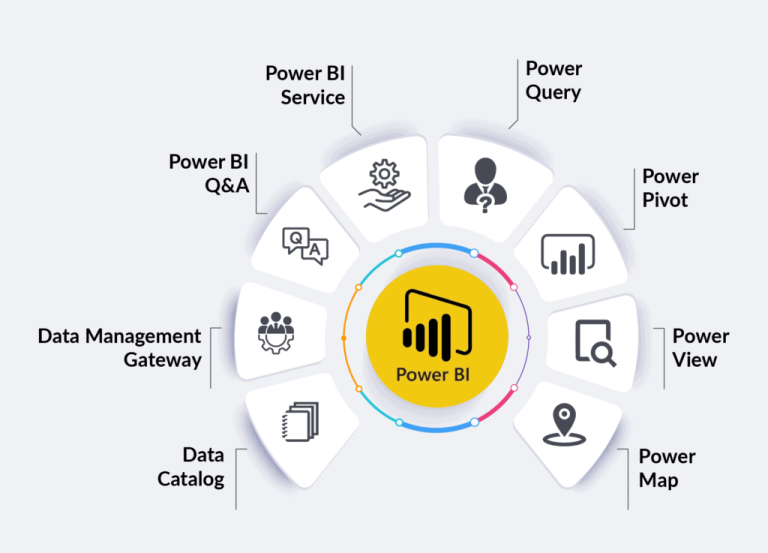
  • Components of Power BI
  • Understanding Power BI Services

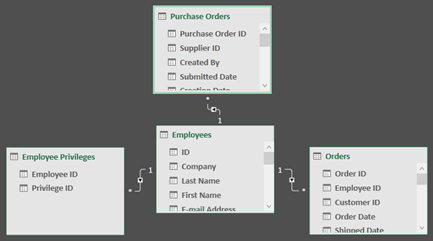
Section 2: Design a data model in Power BI

  • Get data from files & folders

    Advanced Analytics in Power BI Class

  • Get data from relational data sources
  • Get data from a NoSQL database
  • Get data from online services
  • Select a storage mode
  • Get data from Azure Analysis Services
  • Fix performance issues
  • Resolve data import errors
  • Understanding Constraints & Performance issues
  • Understand data types mismatch issues
  • Resolving data quality errors

Section 3: Data Cleansing With Power BI

  • Shape the initial data
  • Simplify the data structure
  • Evaluate and change column data types
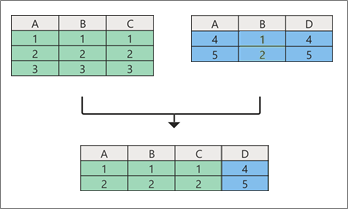
  • Combine multiple tables into a single table
  • Profile data in Power BI
  • Use Advanced Editor to modify M code

Section 4: Creating Advanced DAX measures in Power BI

  • Using the Calculate function
  • Understanding Filter Context
  • Using IF, SWITCH, FIND
  • Using VALUES, HASONEVALUE, SELECTEDVALUE, and CONCATENATEXUse sophisticated Time Intelligence Functions in Power BI
  • Using ALL, ALLEXCEPT, ALLSELECTED, KEEPFILTERS
  • Creating Virtual Tables
  • Create semi-additive measures
  • Advanced Date Comparisons With Same Period Last Year, Year To Date, Month to date totals,
  • Using Date Functions like DATEADD, FIRSTDATE, LASTDATE, NEXTYEAR
  • Writing Custom Time Intelligence Functions
  • Using RELATED & RELATEDTABLE functions in Power BI

Section 5: Performance Optimization in Power BI

  • Performance optimization Considerations
  • Review performance of Measures, Relationships, and visuals
  • Using variables to improve performance & Troubleshooting
  • Reduce cardinality in the Data Model
  • Optimize DirectQuery models with table level storage
  • Create and manage aggregations

Power BI Dashboard Course for Advanced Users

Section 6: Working with Power BI visuals

  • Introduction to Advanced Power BI visualizations
  • Add visualization items to reports
  • Choose an effective visualization
  • Format and configure visualizations
  • Import a custom visual into Power BI
  • Add an R or PYTHON visual in a reportPython Visuals in Power BI Advanced training course

Section 7: Create a data-driven story with Power BI reports

  • Introduction to create a data-driven story with Power BI reports
  • Design a report layout
  • Add buttons, bookmarks, and selections
  • Design report navigation
  • Use advanced interactions and drill through
  • Configure conditional formatting
  • Apply slicing, filtering, and sorting
  • Publish and export reports
  • Comment on reports
  • Fine Tune report performance
  • Optimize reports for mobile use

Section 8: Create dashboards in Power BI

  • Introduction to dashboards
  • Configure data alerts
  • Explore data by asking questions
  • Add a dashboard theme
  • Pin a live report page to a dashboard
  • Configure a real-time dashboard
  • Configure data classification
  • Explore mobile view & Auto Mobile Layouts

Section 9: Perform analytics in Power BI

  • Introduction to analytics
  • Advanced Power BI Course in Singapore at Intellisoft SystemsExplore statistical summary
  • Identify outliers with Power BI visuals
  • Group and bin data for analysis
  • Apply clustering techniques
  • Conduct time series analysis
  • Use the Analyze feature
  • Use advanced analytics custom visuals
  • Review Quick insights
  • Apply AI Insights

Section 10: Work with AI visuals in Power BI

  • Introduction to working with AI visuals
  • Use the Q&A visual
  • Find important factors with the Key influencers visual
  • Use the Decomposition Tree visual to break down a measure

Section 11: Create and manage workspaces in Power BI

  • Distribute a report or dashboard
  • Monitor usage and performance
  • Recommend a development life cycle strategy
  • Troubleshoot data by viewing its lineage
  • Configure data protection

Section 12: Secure Access With Row-Level Security

  • Configure row-level security with the static method
  • Configure row-level security with the dynamic method

Section 13: Manage datasets in Power BI

  • Create dynamic reports with parameters
  • Create what-if parameters
  • Use a Power BI gateway to connect to on-premises data sources
  • Configure a dataset scheduled refresh
  • Configure incremental refresh settings
  • Manage and promote datasets
  • Troubleshoot service connectivity

Go To Top

  • Basic knowledge of Power BI, including data import and basic DAX measures.
  • Familiarity with creating basic reports and dashboards in Power BI.

Go To Top

SkillsFuture Ready

Singaporeans can use $500 SkillsFuture Credits for this training to offset the course fees.

Contact us for advise on how to go about claiming your SkillsFuture.

Get Started Today!

Learn By Doing

You learn best when you Do It Yourself.

We teach you, step by step, how you can learn new skills, build your knowledge and enhance your career prospects quickly & easily, with Practical Tips & Tricks!

Do You Have Any Questions or Need a Quotation?

Simple. Just tell us what you need. We’ll be glad to help you!

Some of the companies that experienced our trainings

"What I love about this training is that the trainers make sure we learn the steps and are able to do it on our own. This is a real advantage and I will definitely come back for more practical training"
Michele Martin
HR Manager
“The training was everything I hoped for, and more. Intellisoft Systems really makes a difference, I would have never discovered the hidden features of the sotftware on my own. Thanks a lot Intellisoft !"
Joy Tan
Project Engineer

How To Register

 Register for Advanced Power BI Training Course in Singapore at Intellisoft

  1. Visit Our Website: Go to Intellisoft Training.
  2. Find the Course: Navigate to the “Advanced Power BI” course page.
  3. Fill Out the Form: Complete the registration form with your details & Submit the form

This hands-on, practical course will be taught by Power BI Guru Vinai Prakash, who has over 35 years of experience in data analysis and business intelligence.

Don’t miss this opportunity to learn from the best and transform your data analysis capabilities!

TESTIMONIALS FROM OUR ADVANCED POWER BI COURSE ATTENDEES

“The Advanced Power BI course exceeded my expectations. Vinai’s expertise and practical approach made complex concepts easy to understand. I feel much more confident in my ability to create impactful reports and dashboards now.” Sarah Lim, Data Analyst, Vodafone

“Taking this course was a game-changer for my career. The hands-on exercises and real-world examples provided invaluable insights. Vinai is an outstanding instructor who truly cares about his students’ success.”
John Tan, Director, Business Innovation

Best Advanced Power BI dashboard Course in Singapore


Accelerate Your Career With the Most Effective & Practical Training.

Training Course Fees

The full course fees for this training is S$1,200, before any Government funding.
For Singaporean/PR above 21 years, Training Grants are available.
For Foreigners, no government grants are available.

Grant Information

WSQ funding from SkillsFuture Singapore (SSG) is available to Singaporeans/PRs above 21.
(Both Individuals & Company Sponsored ).

Individual Singaporeans, 25 years & above can also use their SkillsFuture Credits for this training at Intellisoft.

Companies sending Locals & Foreign staff for training can avail SFEC Funding
Use it to improve the skills of your entire department!

NTUC Members can utilize UTAP Funds to offset 50% of the remaining fees*.

Contact us for more information on How to apply for this SkillsFuture Grant.
Call +65-6252-5033 for Details or WhatsApp Now at +65-9066-9991

up to 70% Grant

$840 Funding by SSG
Pay $360
  • Singaporeans Above 40 Years
  • Individuals
  • SME Companies
  • Individuals Can Use SkillsFuture
  • UTAP Funding*

up to 50% Grant

$600 Funding by SSG
Pay $600
  • Below 40 Years
  • Individuals
  • SG / PR / MNC Companies
  • SkillsFuture (Singaporeans only)
  • UTAP Funding*

Power Query & Power Pivot for Deep Analysis with Excel

Power Query and Power Pivot in Excel Course at Intellisoft Singapore

Power Query is a feature in Excel that allows you to quickly import data from multiple sources and easily clean, transform, and reshape it to suit your needs. We show you how to use this powerful, time-saving tool to do deep cleansing of data, and then do a deeper analysis of data with Microsoft Excel’s Power Pivot. This course teaches you how to import, merge, rearrange, and clean data, as well as how to repeat the process with one click if the data changes.

Power Query Training in Singapore at Intellisoft

Discover how to split columns, unpivot data, and use joins to merge, segment, and compare datasets. Data Analysis Expressions (DAX) allow Microsoft Excel users to create powerful calculated fields in Power Pivot. In this course, you will learn how to use the DAX language and Power Pivot to explore and analyze relational data models. You will master how to add calculated columns and measures to data models in Excel.

Power Pivot Options in Excel - Learn Power Pivot with WSQ Funding in Singapore at Intellisoft

We highlight the differences between calculated columns and DAX measures, covers common DAX formulas and functions, and discusses best practices for working with DAX and Power Pivot.

Full of dozens of tips, tricks & techniques in this comprehensive, practical, hands-on training using Power Query and Power Pivot in Excel for Deep Data Analysis.

The “Power Query & Power Pivot for Deep Analysis with Excel” course is designed to equip participants with advanced skills in data manipulation, analysis, and visualization using Excel’s powerful tools, Power Query and Power Pivot.

Participants will start by mastering Power Query, learning how to import data from various sources, clean and transform it efficiently. Moving into Power Pivot, they will delve into data modeling techniques, establishing relationships between tables, and creating calculated columns and measures using DAX expressions.

Power Query Training in Excel at Intellisoft Singapore - Learn How To Merge in Power Query at Intellisoft

Throughout the course, emphasis will be placed on practical applications through hands-on exercises and real-world case studies, enabling participants to analyze complex datasets, generate insightful visualizations, and optimize performance for large-scale data scenarios.

By the end of the course, participants will have the tools and knowledge to confidently handle diverse data challenges, automate workflows, and enhance decision-making processes using Excel as a robust analytical platform.

Go To Top

The target audience for the “Power Query & Power Pivot for Deep Analysis with Excel” course includes professionals and individuals who work extensively with data in Excel and wish to deepen their analytical capabilities. This course is ideal for:

  1. Data Analysts: Professionals who analyze and interpret data regularly and want to leverage advanced Excel tools for more efficient and insightful analysis.
  2. Business Intelligence Professionals: Individuals involved in creating reports, dashboards, and data visualizations who seek to enhance their skills in data modeling and manipulation.
  3. Financial Analysts: Those responsible for financial modeling, forecasting, and budgeting who want to streamline data handling and improve accuracy in their analyses.
  4. Excel Power Users: Individuals already proficient in Excel who want to expand their toolkit with Power Query and Power Pivot for more sophisticated data transformations and analysis.
  5. Managers and Decision-Makers: Leaders who rely on data-driven insights to make informed decisions and wish to improve their ability to extract and present meaningful insights from data.
  6. IT Professionals and Consultants: Those tasked with managing and optimizing data workflows within organizations who want to leverage Excel’s capabilities for enhanced data management and reporting.

Overall, the course is suitable for anyone looking to advance their Excel skills specifically for data analysis, whether in business, finance, consulting, or other fields where data-driven decision-making is critical.

Go To Top

Power Query & Power Pivot for Deep Analysis with Excel

Course Outline

Day 1: Power Query Essentials and Intermediate Techniques

Power Pivot Data Model Training in Singapore at Intellisoft

Module 1: Introduction to Power Query

  • Understanding the Role of Power Query in Data Preparation
  • Navigating the Power Query Interface
  • Key Use Cases of Power Query in Business Scenarios
  • Differences Between Power Query in Excel and Power BI

Module 2: Data Transformation Basics

  • Importing Data from Various Sources (Excel, CSV, SQL, Web, etc.)
  • Data Cleaning Techniques: Removing Errors, Replacing Values
  • Reordering Columns and Rows for Analysis
  • Splitting and Merging Columns

Module 3: Advanced Data Transformation

  • Advanced Filtering Techniques for Targeted Data Extraction
  • Creating Custom Columns with Conditional Logic
  • Using the Fill Down and Fill Up Features for Missing Data
  • Advanced Grouping and Aggregating Techniques for Summarized Data

Module 4: Introduction to M Language

  • Exploring the M Language Syntax and Structure
  • Editing Queries Directly in the Advanced Editor
  • Creating Custom Functions for Reusable Logic
  • Common M Functions for Data Manipulation (e.g., Table.TransformColumns, Text.Combine)

Module 5: Case Studies and Practical Exercises

  • Real-World Scenario: Preparing Sales Data for Reporting
  • Combining Data from Multiple Files and Folders
  • Practice Exercises with Provided Datasets
  • Group Discussion on Common Data Challenges

Day 2: Power Pivot and Advanced Analytics

Module 6: Introduction to Power Pivot

  • Overview of the Power Pivot Add-in: Activation and Setup
  • Loading Data into the Power Pivot Data Model
  • Understanding Table Relationships: One-to-One, One-to-Many
  • Creating Hierarchies for Advanced Data Navigation

Module 7: DAX Fundamentals

  • Overview of DAX: Syntax and Functions
  • Understanding Row Context vs. Filter Context
  • Creating Basic Calculated Columns and Measures
  • Using Aggregation Functions (SUM, AVERAGE, COUNT, DISTINCTCOUNT)

Module 8: Advanced DAX Techniques

  • Time Intelligence Functions: Calculating YTD, QTD, MTD, and Rolling Averages
  • Advanced Logical Functions: SWITCH, IFERROR, CALCULATE
  • Working with Iterative Functions: SUMX, AVERAGEX
  • Troubleshooting DAX Formulas and Debugging Errors

Module 9: Optimizing Data Models

  • Understanding the Importance of Star and Snowflake Schemas
  • Best Practices for Efficient Data Models: Reducing File Size, Avoiding Duplicates
  • Using the Diagram View for Relationship Management
  • Performance Tuning: Analyzing and Optimizing Query Performance

Module 10: Advanced Analytics and Reporting

  • Creating Slicers and Filters for Interactive Dashboards
  • Designing Effective Power Pivot Reports with Visual Insights
  • Using KPIs to Track and Display Key Business Metrics
  • Integrating Power Query and Power Pivot for Dynamic Reporting

Module 11: Final Project and Review

  • Hands-On Project: Building an Interactive Dashboard from Raw Data
  • Applying Power Query and Power Pivot to Solve Business Problems
  • Course Recap: Key Takeaways and Best Practices

These objectives aim to provide participants with a comprehensive understanding and practical skills in leveraging Power Query and Power Pivot for deep data analysis within Excel, preparing them to handle complex data challenges effectively.

Go To Top

To join the “Power Query & Power Pivot for Deep Analysis with Excel” course, participants should ideally have the following prerequisites:

  1. Proficiency in Excel: Participants should be familiar with basic to intermediate Excel functionalities, including navigating through worksheets & using simple formulas and functions.
  2. Understanding of Data Concepts: A basic understanding of fundamental data concepts such as tables, rows, columns, and data types is recommended.
  3. Familiarity with Data Analysis: Some experience in data analysis tasks like sorting, filtering, and basic data manipulation within Excel will be beneficial.
  4. Motivation to Learn: An eagerness to explore advanced data manipulation techniques and a willingness to engage in hands-on exercises and case studies throughout the course.

These prerequisites will ensure that participants can effectively engage with the course content, grasp advanced concepts in Power Query and Power Pivot, and apply their knowledge to real-world data analysis challenges using Excel.

Go To Top

SkillsFuture Ready

Singaporeans can use $500 SkillsFuture Credits for this training to offset the course fees.

Contact us for advise on how to go about claiming your SkillsFuture.

Get Started Today!

Learn By Doing

You learn best when you Do It Yourself.

We teach you, step by step, how you can learn new skills, build your knowledge and enhance your career prospects quickly & easily, with Practical Tips & Tricks!

Do You Have Any Questions or Need a Quotation?

Simple. Just tell us what you need. We’ll be glad to help you!

Some of the companies that experienced our trainings

"What I love about this training is that the trainers make sure we learn the steps and are able to do it on our own. This is a real advantage and I will definitely come back for more practical training"
Michele Martin
HR Manager
“The training was everything I hoped for, and more. Intellisoft Systems really makes a difference, I would have never discovered the hidden features of the sotftware on my own. Thanks a lot Intellisoft !"
Joy Tan
Project Engineer

How To Register

To register for the “Power Query & Power Pivot for Deep Analysis with Excel” course, you have several convenient options:

  1. Online Registration: Visit our website and navigate to the registration page. Fill out the online registration form with your details and course preferences. You can typically find the registration link under the course description or on our homepage.
  2. Walk-in Registration: Feel free to visit our office during business hours. Our staff will be happy to assist you with the registration process in person. You can find our office address and hours of operation on our website.
  3. Email Registration: Send us an email indicating your interest in the course. Include your name, contact information, and any specific questions you may have. Our team will respond promptly and guide you through the registration steps via email.
  4. WhatsApp: If you prefer to communicate via WhatsApp, send us a message with your name and the course you wish to register for. We will reply with further instructions and assist you through the registration process.
  5. Drop by Our Office: If you’re in the City Area around Bugis, Rochor, Bencoolen, Bras Basah, Dhoby Ghat, you can drop by our office directly at Fortune Centre. Our staff will be available to answer your questions and assist you with completing the registration form on-site.

For more information about the course, feel free to email us at training@intellisoft.com.sg or reach out via WhatsApp at +65-90669991. We look forward to helping you register and start your journey with Power Query and Power Pivot for deep analysis with Excel!

Accelerate Your Career With the Most Effective & Practical Training.

Training Course Fees

The full course fees for this training is S$1,000, before any Government funding.
For Singaporean/PR above 21 years, Training Grants are available.
For Foreigners, no government grants are available.

Grant Information

WSQ funding from SkillsFuture Singapore (SSG) is available to Singaporeans/PRs above 21.
(Both Individuals & Company Sponsored ).

Individual Singaporeans, 25 years & above can also use their SkillsFuture Credits for this training at Intellisoft.

Companies sending Locals & Foreign staff for training can avail SFEC Funding
Use it to improve the skills of your entire department!

NTUC Members can utilize UTAP Funds to offset 50% of the remaining fees*.

Contact us for more information on How to apply for this SkillsFuture Grant.
Call +65-6250-3575 for Details or WhatsApp Now at +65-9066-9991

70% Grant

$700 Funding by SSG
1000
Pay $300
  • Singaporeans Above 40 Years
  • Individuals
  • SME Companies
  • Individuals Can Use SkillsFuture
  • UTAP Funding*

50% Grant

$500 Funding by SSG
1000
Pay $500
  • Below 40 Years
  • Individuals
  • SG / PR / MNC Companies
  • SkillsFuture (Singaporeans only)
  • UTAP Funding*

Infographics & Data Visualization with Excel

Excel training at Intellisoft in Singapore

Learn to Analyze & Visualize Data With Infographics & Pivot Tables

Up To 70% WSQ Grant. Use SkillsFuture & UTAP to offset the balance.

Learn Advanced Excel Skills to Save Time & Impress
Achieve More with Data Analysis & Visualizaiton Tricks

What Will You Learn in this Advanced Excel Training?

Create Infographics & Visualize Data
With Advanced Excel Tricks: Course Overview

Learn By Doing

You learn best when you Do It Yourself.

We teach you, step by step, how you can learn new skills, build your knowledge and enhance your career prospects quickly & easily, with Practical Tips & Tricks!

Microsoft Training at Intellisoft

Claim WSQ Grant

Singaporeans & PRs (individuals or Company Sponsored) can claim up to 70% WSQ Grant*.

* Subject to SSG Eligibility Criteria

Contact us To Calculate Your Grant Amount

SkillsFuture Ready

Singaporeans can use $500 SkillsFuture Credits for this training to offset the course fees.

Contact us for advise on how to go about claiming your SkillsFuture.

Get Started Today!

Training Course Fees

The full course fees for this training is S$750, before any Government funding.
For Singaporean/PR above 21 years, Training Grants are available.
For Foreigners, no government grants are available.

Grant Information

WSQ funding from SkillsFuture Singapore (SSG) is available to Singaporeans/PRs above 21.
(Both Individuals & Company Sponsored ).

Individual Singaporeans, 25 years & above can also use their SkillsFuture Credits for this training at Intellisoft.

Companies sending Locals & Foreign staff for training can avail SFEC Funding
Use it to improve the skills of your entire department!

NTUC Members can utilize UTAP Funds to offset 50% of the remaining fees*.

Contact us for more information on How to apply for this SkillsFuture Grant.
Call +65-6252-5033 for Details or WhatsApp Now at +65-9066-9991

70% Grant

$525 Funding by SSG
Pay $225
  • Singaporeans Above 40 Years
  • Individuals
  • SME Companies
  • Individuals Can Use SkillsFuture
  • UTAP Funding*

50% Grant

$375 Funding by SSG
Pay $375
  • Below 40 Years
  • Individuals
  • SG / PR / MNC Companies
  • SkillsFuture (Singaporeans only)
  • UTAP Funding*

Do You Have Any Questions or Need a Quotation?

Simple. Just tell us what you need. We’ll be glad to help you!

Some of the companies that experienced our trainings

"What an insight into Infographics & Data Analysis. The trainers make sure we learn the steps and do it on our own. I will come back for more practical training"
Daniel Martin
Sales Director
“The training was everything I hoped for, and more. I would have never discovered the hidden infographic features of Excel on my own. Thanks a lot Intellisoft !"
Patrick Han
Finance Controller

How To Register

Accelerate your Career With the Most Effective Training!

Basic Data Analytics with Excel for Beginners

Advanced Excel training at Intellisoft Singapore

Basic-Intermediate Excel Course (WSQ Funded)

Use 70%* WSQ Grant, SkillsFuture & UTAP

What Will You Learn in Basic Data Analytics Course with Excel?

Learn Excel Fundamentals To Save Time & Improve Productivity

Simple Tables & Charts in Excel

WSQ Grant of up to 50-70%

The process of analyzing a data set for patterns and identifying which variables and values are most relevant through data transformation and mining. Data analysis is the foundation of good business decisions and effective action.

Hence this Beginners course in Microsoft Excel will start with an overview of data analytics strategy aligned to the organization’s overall data analytics metrics for various products and services.

Then the participants will learn to use Excel for data preparation. 

After learners learn Excel’s basic data preparation techniques, they can proceed to data analysis and visualization using Microsoft Excel for business.

Master Excel To Get Work Done Fast,
Create Tables, Formulas, Charts, Sort, Filter & Visualize Like a Pro...

Advanced Excel training at Intellisoft

Learn Basic-Intermediate Excel (Course Outline)

Objectives WSQ Course for Beginners in Excel in Singapore:

Upon completion of the Basic Excel for Beginners course, you will be able to perform basic analytics with Excel. You will be able to understand better customer activities and behavior using Excel for business. Effective visualization techniques with charts enhance the data understanding and make it easier to report the data analytics findings.

Basic-Intermediate Excel 2019 Training @Intellisoft

Improve your productivity and efficiency with the new time saving features in Excel 2019.

A very Practical, Hands – on approach to learning Excel – by doing exercises, and learning simple tips and tricks in the class.

The class is taught by Certified, Experienced Microsoft Trainers with years of experience in using Microsoft Excel.

Learn Microsoft Excel tips & techniques that will make your work faster, efficient, and you will be able to do complex tasks in a matter of minutes.

Go To Top

Target Audience For Basic Excel Training 2019 / Microsoft Office 365

This program is highly recommended for those who want to understand the basic concepts of spreadsheets and want to demonstrate the ability to expertly use Microsoft Excel for keying in, manipulating, analysing, visualizing and reporting data easily.

Be prepared to do a lot of Hands-On Exercises on Excel to learn the new concepts and shortcuts, tips & techniques of Microsoft Excel. This is what makes this Excel Training program unique and beneficial for you.

Go To Top

Section 1: Data Preparation

Lesson 1: Data & Corporate Strategy: Introduction to Microsoft Excel

  • Understanding Organization’s product and services
  • Current and emerging data analytics tools and technology trends
  • The need for Microsoft Excel

Lesson 2: Introduction to Excel for Business

  • Getting Started with Excel
  • Using the Ribbon as the Excel User Interface
  • Navigating within the Worksheet
  • Selecting a Cell or Range of Cells
  • Entering Data
  • Cutting, Copying, and Pasting Cell Values
  • Copy and Paste Special
  • Saving & Opening your Workbook

Lesson 3: Managing Rows & Columns in Excel

  • Inserting, Moving & Deleting Cells
  • Managing Columns and Rows
  • Hide and Unhide Rows & Columns
  • Changing Column Width & Row Height

Lesson 4: Organize and Prepare Data

  • Format Worksheet Tabs
  • Insert and Delete Worksheet
  • Move and Copy Worksheet
  • Hide & Unhide Worksheet

Lesson 5: Formatting Cells in Excel

  • Formatting the Cell
  • Number and Date Formatting
  • Finding and Replacing Text
  • Spell Check

Section 2: Data Operations & Data Analysis in Excel

Lesson 6: Formulas & Functions of Microsoft Excel

  • Excel Arithmetic Operators & Order of Operations
  • Using Auto Fill Options
  • Using Basic Functions
  • Writing simple & practical Formulas on your own
  • Absolute Referencing

Lesson 7: Basic Data Analysis With Tables, Sorting, Filtering, Summary Information

  • Create and Modify Tables
  • Sorting and Filtering Data in a Table
  • Getting Summary Information in a Table
  • Formatting a Table For Reporting

Lesson 8: Large Workbooks & Reporting

  • Managing Large Workbooks
  • Printing Worksheets
  • Setting Page Setup Options
  • Setting Page Breaks

***Section 3: Data Visualization***

Lesson 9: Creating Charts For Data Visualization

  • Summarizing Data Visually Using Charts
  • Customizing Chart Data
  • Format Chart Legend and Titles
  • Change the Chart Body
  • Creating a Pie Chart
  • Using Chart Titles & Placing Charts

Lesson 10: Evaluate Data Analysis Findings

  • Tables
  • Visualizations
  • Reports

Go To Top

Pre-Requisites For Basic-Intermediate Excel Training

Basic knowledge of computers, using the keyboard, mouse and Windows is required.

This is a beginner-level program, so we will teach you all about getting started with Excel, and then how to get the most out of it for day-to-day use at your office or home.

All you need is basic PC skills to make the most of this Basic Data Analytics course with Excel Training Course.

Please Note that: 

  1. Participants must sit & pass the short assessment at the end of the training to be eligible for the WSQ grant.
  2. At least 75% of attendance is required by SSG to be eligible for the WSQ funding.
  3. Participants will receive a WSQ certificate of Attainment upon successful completion of training and assessment.

Go To Top

Do You Have Any Questions or Need a Quotation?

Simple. Just tell us what you need. We’ll be glad to help you!

Microsoft Training at Intellisoft

Claim WSQ Grant

Companies sponsoring their staff for training can get upto 70% WSQ Funding.

Individual Singaporeans & PRs are also eligible for up to 70% WSQ Funding.

* SSG Terms & Conditions Apply

SkillsFuture Ready

Singaporeans can use SkillsFuture Credits for this training.

NTUC Members can utilize UTAP.

Get Started Today!

Learn By Doing

You learn best when you Do It Yourself.

We teach you, step by step, how you can learn new skills, build your knowledge and enhance your career prospects quickly & easily, with Practical Tips & Tricks!

Training Course Fees

The full course fees for this training is S$485, before any Government funding.
For Singaporean/PR above 21 years, Training Grants are available.
For Foreigners, no government grants are available.

Grant Information

WSQ funding from SkillsFuture Singapore (SSG) is available to Singaporeans/PRs above 21.
(Both Individuals & Company Sponsored ).

Individual Singaporeans, 25 years & above can also use their SkillsFuture Credits for this training at Intellisoft.

Companies sending Locals & Foreign staff for training can avail SFEC Funding
Use it to improve the skills of your entire department!

NTUC Members can utilize UTAP Funds to offset 50% of the remaining fees*.

Contact us for more information on How to apply for this SkillsFuture Grant.
Call +65-6252-5033 for Details or WhatsApp Now at +65-9066-9991

up to 70% Grant

$339.50 Funding by SSG
Pay $145.50
  • Singaporeans Above 40 Years
  • Individuals
  • SME Companies
  • Individuals Can Use SkillsFuture
  • UTAP Funding*

up to 50% Grant

$242.50 Funding by SSG
Pay $242.50
  • Below 40 Years
  • Individuals
  • SG / PR / MNC Companies
  • SkillsFuture (Singaporeans only)
  • UTAP Funding*

Some of the companies that experienced our trainings

“The expert trainers really made a difference. I would have never discovered so many shortcuts, tips & tricks of Excel on my own! The training was everything I hoped for, and more..."
Michele Martin
Project Engineer
"What I love about this training is that the trainers made sure we practice the steps on our own. The practical exercises & examples helped a lot. I will definitely come back for more trainings"
Joy Tan
HR Manager

How To Register

How To Register For Learning Basic-Intermediate Excel in Singapore

Register for the 2 Days Excel Basics  today by simply clicking on the chosen course date available at the top of this page.

Need Help?

  1. Call us at 6250-3575,  WhatsApp: 9066-9991
  2. Send an email  to  training@intellisoft.com.sg  OR
  3. Submit an online enquiry if you have any questions regarding Excel Basic Data Analytics training.

We have regular public classes For Excel Training each month, and Corporate Training can be arranged at your office too!

Note: This class is a very practical, and hands-on workshop session. It requires you to take part in Excel exercises during the class. A laptop with Excel pre-loaded is provided to each participant for use during this workshop.

SkillsFuture Microsoft Excel Training: 

Join today, and begin to Master Excel with our Step-by-step instructions and helpful, patient, Microsoft Certified Trainers to guide you.

What are you waiting for? Get Started Right away…

Accelerate your Career With the Most Effective Training!

Advanced Data Analytics and Data Visualization with Excel

Data Analysis & Visualization through Infographics creation course in Singapore


Create Dynamic Dashboards in Excel
Quickly & Easily

The Advanced Data Analytics & Data Analytics with Excel will elevate your skills to Excel Mastery.

In this 2 Day Advanced Data Analytics course, you will learn how to do:

  • Statistical Analysis in Excel,
  • Forecasting with Excel,
  • Using Correlation & Regression for detecting underlying Trends,
  • Creating Dynamic Dashboards & Charts,
  • Advanced Pivot Table Technique for Management Reporting
  • How to combine data from multiple worksheets to do data analysis,
  • Creating self-updating charts, reports & dashboards,
  • Performing Scenario Analysis for multi-variate testing & forecasting,
  • PLUS, many more techniques to filter the noise, and visualize the data for Better Decision Making

You should know Excel well to join this course, and it will help you to get closer to Excel mastery.

Now, With up to 70% WSQ Grant*

Analyze & Visualize Data like a Pro
with Hidden Excel Features

Data Analysis & Visualization through Infographics creation course in Singapore

WSQ Grant of up to 50-70%

A good visualization tells a story, removing the noise from data and highlighting useful information, curating data into a form easier to understand, and highlighting the trends and outliers.

Advanced Data Analytics and Visualization course using Microsoft Excel, helps build complex models, making it easy to reach meaningful conclusions, and simplifies the decision-making process.

Companies can then use these insights to identify areas to improve upon and factors that influence customer satisfaction and make better predictions for sales and growth.

Data storytelling helps the data feel alive and ensures that the message it’s conveying is meaningful and relevant, by balancing logic and facts with the emotional impact of a story, companies can better engage their audiences and enhance interactions with their customer base during business events.

By the end of this practical business intelligence with Excel course, you will be able to apply advanced data analytics and data visualization techniques to identify underlying trends and patterns in data with Microsoft Excel.

Data Interpretation Analysis training at Intellisoft Singapore
Data Analysis & Visualization training at Intellisoft Singapore

Learning Data Science, Data Visualisation & Data Analysis are critical skills in gaining a deeper understanding of your data and making better decisions. They help in analyzing the performance of the business & continuous improvement of processes.

This course covers a number of Statistical Data Analysis Techniques for Predictive Analytics, Data Mining, Advanced Data Visualization Techniques & much more… all using Microsoft Excel.  Each method is demonstrated with examples & exercises for your own business analytics.

This is the highest level of Microsoft Excel MasterClass to learn advanced Data visualization & Business Analytics.

Classroom-based lectures with hands-on exercises on analyzing data using Microsoft Excel are used in this workshop to analyze & visualize data and find meaningful information. Data and business analytics provide valuable insights to management.

Excel Data Analysis Training in Singapore at Intellisoft Systems

Excel Data Analysis Course in Singapore at Intellisoft Systems, Singapore[/caption]

Data visualization allows business users to gain insight into their vast amounts of data.

It benefits them to recognize new patterns and errors in the data.

The main goal of data visualization is to make it easier to identify patterns, trends and outliers in large data sets.

Making sense of these patterns can lead to enhanced quality and speed of decision-making processes, as well as measurable increases in productivity and efficiency.

Analyze Data With Charts to identify trends

The objective of this Advanced Data Analytics & Data Visualization training is to help companies in using business intelligence tools to turn raw data into consumable insights, making it a powerful tool people can use to make better, data-driven decisions.

In this course, learners will learn how to leverage the power of Excel to organize and summarize data. They will learn how to use Trend Analysis, Advanced Pivot Table Techniques and Advanced charts to summarize data in a dynamic way based on a selection of values from a list or other Pivot tables.

Data Interpretation & Analysis training at Intellisoft

The course covers Advanced Excel Data Analytics & Data Visualization Topics, like:

  • Best Excel functions for deeper data analysis, data mining & business analytics
  • Tips for cleansing, transforming & modelling data,
  • Sensitivity Analysis with Data Tables,
  • Goal Seek Find the missing pieces,
  • Advanced Excel Visualisation Techniques using Multiple Charts, Pivots & Slicers
  • Data Modeling & Linear Regression for Predictive Analysis
  • Creation of Excel Dashboards for Business Intelligence & Management Reporting of Insights

 Learn The Secrets of Data Analytics With Excel, & Become a Power Ninja Data Analyst!

Go To Top

Data Analyst reviewing data insightsMost data analysts, managers, decision-makers, and even end users typically struggle with report creation as they lack knowledge of features such as data analysis, data cleanup, advanced pivot tables techniques, and visualization techniques within Excel.

With this WSQ course, we target such people and will help such people learn advanced data analytic and data visualization techniques to organize data better and represent the same in both a dynamic tabular and chart format.

After attending this WSQ Advanced Excel Data Analytics & Visualization course, our audience will be better able to:

  1. Organize data within excel in a “normalized” way to create dynamic reports.
  2. Create Pivot tables and charts that provide a dynamic view of data based on slider selections.
  3. Create infographics summaries that are linked to the analyzed data and Pivot tables.

Go To Top

Advanced Data Analytics & Data Visualization Course With Excel
Course Outline

This is a very practical, hands-on, and insightful course, full of advanced Excel techniques to bring in the data, analyze it quickly, identify trends, and visualize the information in charts, graphs and dashboards.

Data Analysis & Visualization Training in Singapore at Intellisoft With WSQ Funding

Module 1: Data Modeling Using Pivot Tables & Pivot Charts

  • Introduction to Data Modeling
  • Data Filtering & Transformation
  • Use Pivots to identify patterns across multiple data sets
  • Visual Analysis with Pivot Charts

Module 2: Solver and Scenarios to Manage Multiple Constraints

  • Managing Multiple Constraints
  • Proof of concept using Data Solver
  • Decision Making using Scenarios

Module 3: Data Modeling & Linear Regression for Better Forecasts

  • Data Modeling Principles
  • Building a Model With Excel
  • Using Linear Regression

Module 4: Data Mining and Goal Seek To Derive Business InsightsExcel Dynamic Dashboard Course in Singapore

  • Data Mining With Lookup Functions
  • Business Insights From Goal Seek
  • Advanced Use Cases for Data Mining With Excel Functions

Module 5: Statistical Analysis and Data Visualization Dashboards

  • Key Principles of Data Visualization
  • Presentation of qualitative data-driven visualization
  • Statistical analysis of data

Learn The Secrets of Data Analysis With Excel Today in Singapore.

Join This  Practical Training
To Get Ahead With Advanced
Business Data Analysis & Visualization.

data analysis course

Learn The Best Excel Functions & Features for Data Analytics!

Business Data Analytics With Excel Course Trainer:

Advanced Data Analytics and Data Visualization with Excel Training at Intellisoft.

This Excel Data Analysis course is created and delivered by Vinai Prakash, Master Trainer & Founder of Intellisoft Systems.

Vinai has authored several articles on Data Analysis, Excel Dashboarding Techniques, Data Warehousing, Data Mining, Using SQL Databases for Creating Data-Rich applications, published in leading magazines, newspapers & books.

Click Here to Download The 8 Habits of Highly Effective Data Analysts(An article written by Vinai Prakash, published in The Straits Times Newspaper in Singapore)

Go To Top

It would be great if you have good knowledge of Excel and could write simple formulas like SUM, IF, Create Bar Charts and use Excel on a regular basis for basic analysis and reporting.

  • Good knowledge and experience in using Excel on a regular basis.
  • Familiarity with Basic Excel functions is a must.
  • A passion for acquiring Data Analysis Superpowers.
  • Note: Anyone with Database, Business Intelligence, IT Programming, or similar experience are pretty qualified to take this course, even if lacking in everyday Excel experience.

Microsoft Excel software is available for download from the Microsoft website as a subscription. We will provide you with a copy of Microsoft Excel for use in the class, on our laptops.

Go To Top

SkillsFuture Ready

Singaporeans can use $500 SkillsFuture Credits for this training to offset the course fees.

Contact us for advise on how to go about claiming your SkillsFuture.

Get Started Today!

Learn By Doing

You learn best when you Do It Yourself.

We teach you, step by step, how you can learn new skills, build your knowledge and enhance your career prospects quickly & easily, with Practical Tips & Tricks!

Do You Have Any Questions or Need a Quotation?

Simple. Just tell us what you need. We’ll be glad to help you!

Some of the companies that experienced our trainings

"What I love about this training is that the trainers make sure we learn the steps and are able to do it on our own. This is a real advantage and I will definitely come back for more practical training"
Michele Martin
HR Manager
“The training was everything I hoped for, and more. Intellisoft Systems really makes a difference, I would have never discovered the hidden features of the sotftware on my own. Thanks a lot Intellisoft !"
Joy Tan
Project Engineer

How To Register

How To Register For Advanced Data Analytics & Data Visualization With Excel Course in Singapore

Register for the 2 Days Advanced Excel Data Analytics & Data Visualization MasterClass Course today by simply clicking on the chosen course date available at the top of this page.

Need Help?
Call us at +65-6250-3575, SMS / WhatsApp: 9066-9991

Send an email to training@intellisoft.com.sg

We have regular public classes For Advanced Data Analytics & Visualization With Excel MasterClass each quarter, and Corporate Training can be arranged at your office too!

Infographic of Financial Reports

Note: This class uses a convenient and hands-on approach to gain Excel Analytics & Visualization Mastery. It requires you to take part in Data Analysis & Data Visualization exercises during the class. You can bring your own laptop or request to use our computer during the class beforehand.

WSQ Funded Data Analytics and Visualization With Microsoft Excel Training:

Join today, and begin to Master Excel Data Analytics with our Step-by-step instructions and helpful, patient, Microsoft Certified Trainers to guide you.

What are you waiting for? Get Started Right away…

Accelerate Your Career With the Most Effective & Practical Training.

Training Course Fees

The full course fees for this training is S$900, before any Government funding.
For Singaporean/PR above 21 years, Training Grants are available.
For Foreigners, no government grants are available.

Grant Information

WSQ funding from SkillsFuture Singapore (SSG) is available to Singaporeans/PRs above 21.
(Both Individuals & Company Sponsored ).

Individual Singaporeans, 25 years & above can also use their SkillsFuture Credits for this training at Intellisoft.

Companies sending Locals & Foreign staff for training can avail SFEC Funding
Use it to improve the skills of your entire department!

NTUC Members can utilize UTAP Funds to offset 50% of the remaining fees*.

Contact us for more information on How to apply for this SkillsFuture Grant.
Call +65-6250-3575 for Details or WhatsApp Now at +65-9066-9991

70% Grant

$630 Funding by SSG
900
Pay $270
  • Singaporeans Above 40 Years
  • Individuals
  • SME Companies
  • Individuals Can Use SkillsFuture
  • UTAP Funding*

50% Grant

$450 Funding by SSG
900
Pay $450
  • Below 40 Years
  • Individuals
  • SG / PR / MNC Companies
  • SkillsFuture (Singaporeans only)
  • UTAP Funding*

Data Analytics & Visualization with Power BI

Power BI course in Singapore at Intellisoft

The Best Power BI Class in Singapore

Master Power BI with 70% WSQ Grant*

WSQ, UTAP & SkillsFuture Grants in Singapore

What Will You Learn in Power BI MasterClass

Course Overview:
Data Analytics & Visualization With Power BI

Course Objectives

Features of Power BI Course at Intellisoft Systems in Singapore

Course Outline

Training Course Fees

The full course fees for this training is S$1,000, before any Government funding.
For Singaporean/PR above 21 years, Training Grants are available.
For Foreigners, no government grants are available.

Grant Information

WSQ funding from SkillsFuture Singapore (SSG) is available to Singaporeans/PRs above 21.
(Both Individuals & Company Sponsored ).

Individual Singaporeans, 25 years & above can also use their SkillsFuture Credits for this training at Intellisoft.

Companies sending Locals & Foreign staff for training can avail SFEC Funding
Use it to improve the skills of your entire department!

NTUC Members can utilize UTAP Funds to offset 50% of the remaining fees*.

Contact us for more information on How to apply for this SkillsFuture Grant.
Call +65-6250-3575 for Details or WhatsApp Now at +65-9066-9991

70% Grant

$700 Funding by SSG
1000
Pay $300
  • Singaporeans Above 40 Years
  • Individuals
  • SME Companies
  • Individuals Can Use SkillsFuture
  • UTAP Funding*

50% Grant

$500 Funding by SSG
1000
Pay $500
  • Below 40 Years
  • Individuals
  • SG / PR / MNC Companies
  • SkillsFuture (Singaporeans only)
  • UTAP Funding*

Do You Have Any Questions or Need a Quotation?

Simple. Just tell us what you need. We’ll be glad to help you!

Power BI Feature Set

Target Audience

Learn By Doing

You learn best when you Do It Yourself.

We teach you, step by step, how you can learn new skills, build your knowledge and enhance your career prospects quickly & easily, with Practical Tips & Tricks!

SkillsFuture Ready

Singaporeans can use $500 SkillsFuture Credits for this training to offset the course fees.

Contact us for advise on how to go about claiming your SkillsFuture.

Get Started Today!

Microsoft Training at Intellisoft

Claim WSQ Grant

Companies sponsoring their staff for training can Claim up to 70% WSQ Funding, subject to SSG Eligibility Criteria.

Applicable for Individual & Company Sponsored Singaporeans/PRs.

Pre-Requisites

Power BI Dashboard Design in Singapore

Register For Power BI Training Course in Singapore

Some of the companies that experienced our trainings

Free Tips, Tutorials & Training Grants Info

Learn from expert tips, tricks and resources for Excel, PowerPoint, Photoshop, Python, Power BI, Project Management, IT, Soft Skills & more with our Email Newsletter.
Plus get the latest news on Grants. Join Today!

Found What You Were
Looking For?

Just Tell us...

We're Here To Help You!