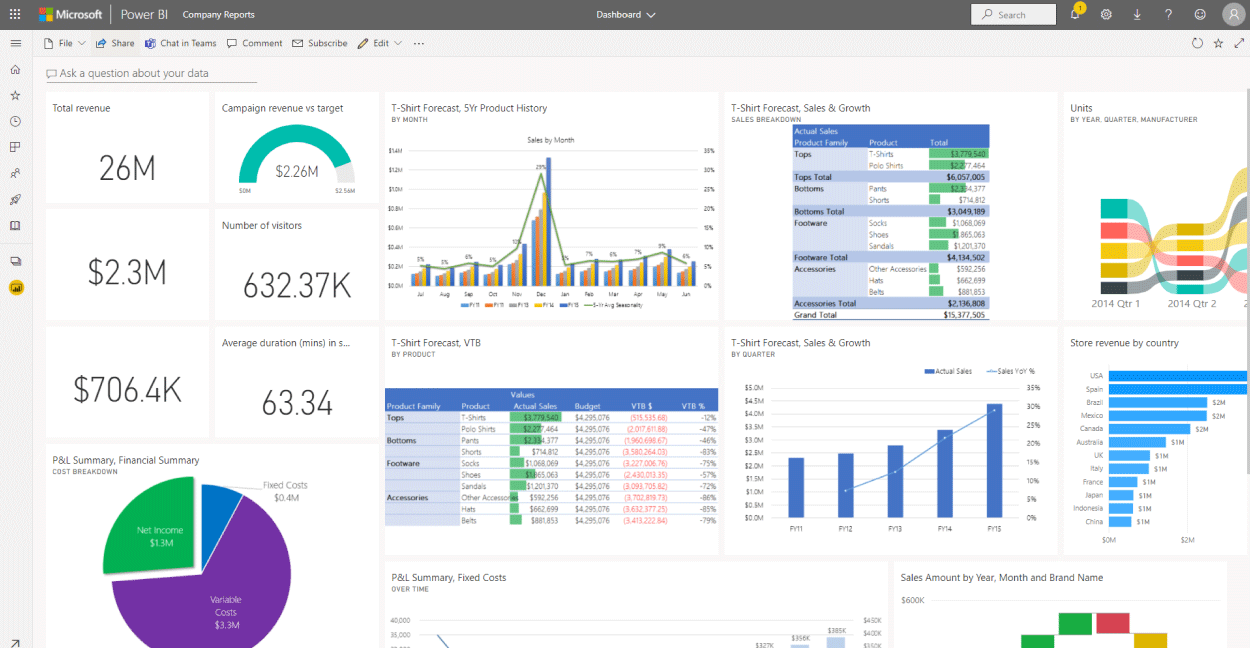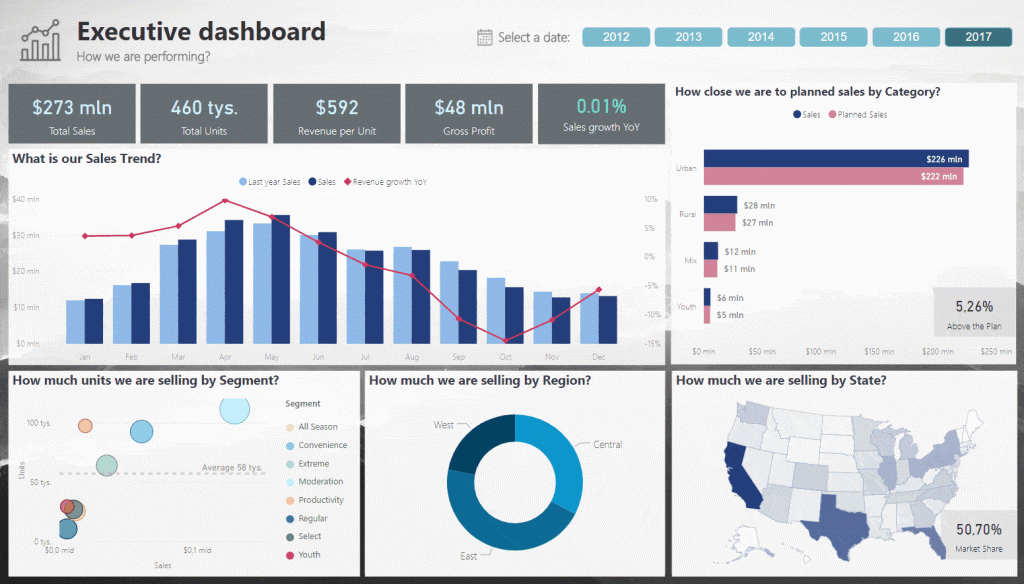
Unlock the full potential of Power BI with our Advanced Power BI course!
Dive deep into
- Advanced DAX measures,
- Explore sophisticated use cases for Power Query, and
- Master data visualization using advanced settings.
Learn to implement row-level security, keep your data models optimized, and import custom visuals.
Enhance your reports with Python or R visuals, and leverage new KPI cards, Gauges, and more to create Stellar Dashboards for your management.
This comprehensive two-day Advanced Power BI course in Singapore is designed for those who already know the basics of Power BI and are ready to elevate their skills to the next level.
Learn From Power BI Experts
Led by Power BI Guru Vinai Prakash, with over 35 years of experience in data analysis and business intelligence, this course promises hands-on, practical learning to empower you with advanced skills.
ADVANCED POWER BI – COURSE OUTLINE
Section 1: Data analytics With Power BI
- Understanding data analytics
- Explore Roles in data Analysis
- Key Tasks for a data analyst
- Introduction to Power BI Desktop Advanced Features
- Components of Power BI
- Understanding Power BI Services
Section 2: Design a data model in Power BI
- Get data from files & folders

- Get data from relational data sources
- Get data from a NoSQL database
- Get data from online services
- Select a storage mode
- Get data from Azure Analysis Services
- Fix performance issues
- Resolve data import errors
- Understanding Constraints & Performance issues
- Understand data types mismatch issues
- Resolving data quality errors
Section 3: Data Cleansing With Power BI
- Shape the initial data
- Simplify the data structure
- Evaluate and change column data types
- Combine multiple tables into a single table
- Profile data in Power BI
- Use Advanced Editor to modify M code
Section 4: Creating Advanced DAX measures in Power BI
- Using the Calculate function
- Understanding Filter Context
- Using IF, SWITCH, FIND
- Using VALUES, HASONEVALUE, SELECTEDVALUE, and CONCATENATEX

- Using ALL, ALLEXCEPT, ALLSELECTED, KEEPFILTERS
- Creating Virtual Tables
- Create semi-additive measures
- Advanced Date Comparisons With Same Period Last Year, Year To Date, Month to date totals,
- Using Date Functions like DATEADD, FIRSTDATE, LASTDATE, NEXTYEAR
- Writing Custom Time Intelligence Functions
- Using RELATED & RELATEDTABLE functions in Power BI
Section 5: Performance Optimization in Power BI
- Performance optimization Considerations
- Review performance of Measures, Relationships, and visuals
- Using variables to improve performance & Troubleshooting
- Reduce cardinality in the Data Model
- Optimize DirectQuery models with table level storage
- Create and manage aggregations
Section 6: Working with Power BI visuals
- Introduction to Advanced Power BI visualizations
- Add visualization items to reports
- Choose an effective visualization
- Format and configure visualizations
- Import a custom visual into Power BI
- Add an R or PYTHON visual in a report
Section 7: Create a data-driven story with Power BI reports
- Introduction to create a data-driven story with Power BI reports
- Design a report layout
- Add buttons, bookmarks, and selections
- Design report navigation
- Use advanced interactions and drill through
- Configure conditional formatting
- Apply slicing, filtering, and sorting
- Publish and export reports
- Comment on reports
- Fine Tune report performance
- Optimize reports for mobile use
Section 8: Create dashboards in Power BI
- Introduction to dashboards
- Configure data alerts
- Explore data by asking questions
- Add a dashboard theme
- Pin a live report page to a dashboard
- Configure a real-time dashboard
- Configure data classification
- Explore mobile view & Auto Mobile Layouts
Section 9: Perform analytics in Power BI
- Introduction to analytics
 Explore statistical summary
- Identify outliers with Power BI visuals
- Group and bin data for analysis
- Apply clustering techniques
- Conduct time series analysis
- Use the Analyze feature
- Use advanced analytics custom visuals
- Review Quick insights
- Apply AI Insights
Section 10: Work with AI visuals in Power BI
- Introduction to working with AI visuals
- Use the Q&A visual
- Find important factors with the Key influencers visual
- Use the Decomposition Tree visual to break down a measure
Section 11: Create and manage workspaces in Power BI
- Distribute a report or dashboard
- Monitor usage and performance
- Recommend a development life cycle strategy
- Troubleshoot data by viewing its lineage
- Configure data protection
Section 12: Secure Access With Row-Level Security
- Configure row-level security with the static method
- Configure row-level security with the dynamic method
Section 13: Manage datasets in Power BI
- Create dynamic reports with parameters
- Create what-if parameters
- Use a Power BI gateway to connect to on-premises data sources
- Configure a dataset scheduled refresh
- Configure incremental refresh settings
- Manage and promote datasets
- Troubleshoot service connectivity
This is a very practical, and hands-on course on Power BI that will transform your Data Analysis skills and make you a PRO in using Advanced Power BI Features
- Master advanced DAX measures for more powerful data analysis.
- Explore advanced use cases and techniques in Power Query.
- Learn data visualization best practices and advanced settings.
- Implement row-level security to protect your data.
- Optimize your data models to keep them small and efficient.
- Import and use custom visuals to enhance your reports.
- Create Python or R visuals for more dynamic data presentations.
- Utilize new KPI cards, gauges, and other visuals to add value.
- Understand and apply AI features, Quick Measures, and Advanced Time Intelligence Comparisons.
- Basic knowledge of Power BI, including data import and basic DAX measures.
- Familiarity with creating basic reports and dashboards in Power BI.
This course is perfect for:
- Business analysts and data professionals who have a basic understanding of Power BI.
- Professionals looking to enhance their data visualization and analysis skills.
- Individuals seeking to implement advanced Power BI features in their work.
- Anyone interested in taking their Power BI knowledge to an intermediate or advanced level.
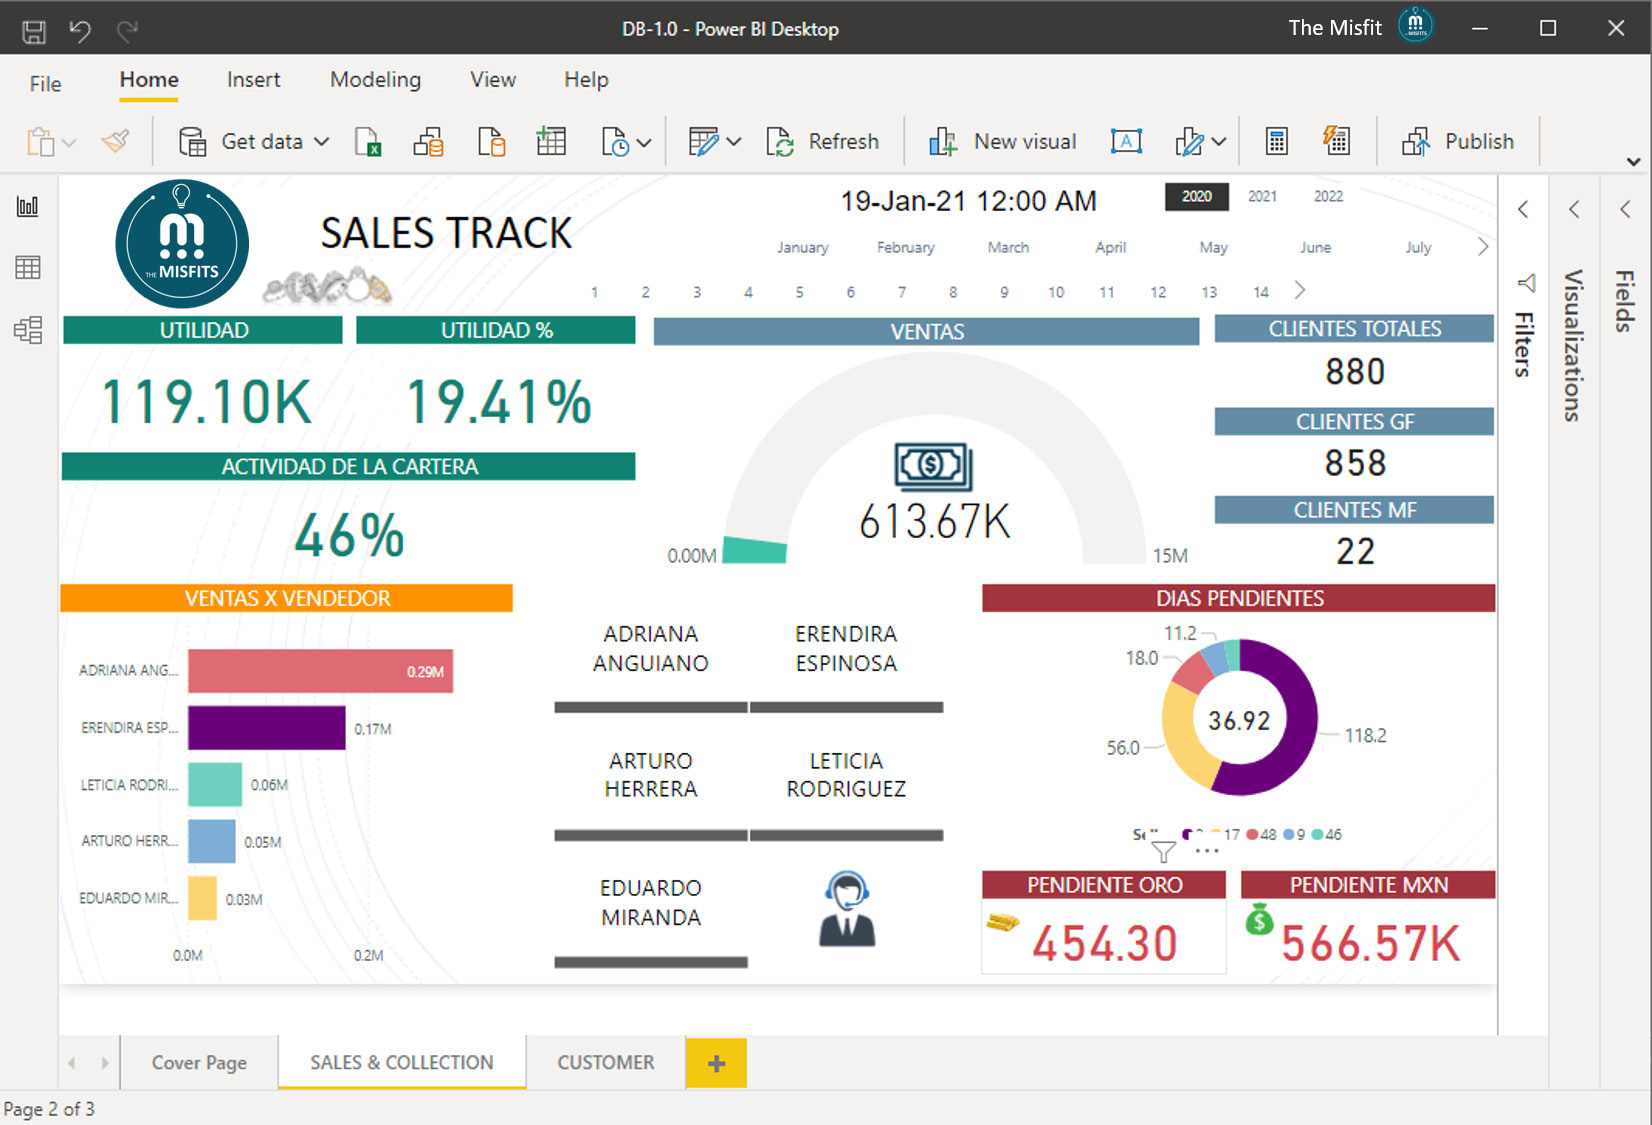
This is a very practical, and hands-on course on Power BI that will transform your Data Analysis skills and make you a PRO in using Advanced Power BI Features
- Master advanced DAX measures for more powerful data analysis.
- Explore advanced use cases and techniques in Power Query.
- Learn data visualization best practices and advanced settings.
- Implement row-level security to protect your data.
- Optimize your data models to keep them small and efficient.
- Import and use custom visuals to enhance your reports.
- Create Python or R visuals for more dynamic data presentations.
- Utilize new KPI cards, gauges, and other visuals to add value.
- Understand and apply AI features, Quick Measures, and Advanced Time Intelligence Comparisons.

This course is perfect for:
- Business analysts and data professionals who have a basic understanding of Power BI.
- Professionals looking to enhance their data visualization and analysis skills.
- Individuals seeking to implement advanced Power BI features in their work.
- Anyone interested in taking their Power BI knowledge to an intermediate or advanced level.

ADVANCED POWER BI – COURSE OUTLINE
Section 1: Data analytics With Power BI
- Understanding data analytics
- Explore Roles in data Analysis
- Key Tasks for a data analyst
- Introduction to Power BI Desktop Advanced Features
- Components of Power BI
- Understanding Power BI Services
Section 2: Design a data model in Power BI
- Get data from files & folders

- Get data from relational data sources
- Get data from a NoSQL database
- Get data from online services
- Select a storage mode
- Get data from Azure Analysis Services
- Fix performance issues
- Resolve data import errors
- Understanding Constraints & Performance issues
- Understand data types mismatch issues
- Resolving data quality errors
Section 3: Data Cleansing With Power BI
- Shape the initial data
- Simplify the data structure
- Evaluate and change column data types
- Combine multiple tables into a single table
- Profile data in Power BI
- Use Advanced Editor to modify M code
Section 4: Creating Advanced DAX measures in Power BI
- Using the Calculate function
- Understanding Filter Context
- Using IF, SWITCH, FIND
- Using VALUES, HASONEVALUE, SELECTEDVALUE, and CONCATENATEX

- Using ALL, ALLEXCEPT, ALLSELECTED, KEEPFILTERS
- Creating Virtual Tables
- Create semi-additive measures
- Advanced Date Comparisons With Same Period Last Year, Year To Date, Month to date totals,
- Using Date Functions like DATEADD, FIRSTDATE, LASTDATE, NEXTYEAR
- Writing Custom Time Intelligence Functions
- Using RELATED & RELATEDTABLE functions in Power BI
Section 5: Performance Optimization in Power BI
- Performance optimization Considerations
- Review performance of Measures, Relationships, and visuals
- Using variables to improve performance & Troubleshooting
- Reduce cardinality in the Data Model
- Optimize DirectQuery models with table level storage
- Create and manage aggregations
Section 6: Working with Power BI visuals
- Introduction to Advanced Power BI visualizations
- Add visualization items to reports
- Choose an effective visualization
- Format and configure visualizations
- Import a custom visual into Power BI
- Add an R or PYTHON visual in a report

Section 7: Create a data-driven story with Power BI reports
- Introduction to create a data-driven story with Power BI reports
- Design a report layout
- Add buttons, bookmarks, and selections
- Design report navigation
- Use advanced interactions and drill through
- Configure conditional formatting
- Apply slicing, filtering, and sorting
- Publish and export reports
- Comment on reports
- Fine Tune report performance
- Optimize reports for mobile use
Section 8: Create dashboards in Power BI
- Introduction to dashboards
- Configure data alerts
- Explore data by asking questions
- Add a dashboard theme
- Pin a live report page to a dashboard
- Configure a real-time dashboard
- Configure data classification
- Explore mobile view & Auto Mobile Layouts
Section 9: Perform analytics in Power BI
- Introduction to analytics
 Explore statistical summary
- Identify outliers with Power BI visuals
- Group and bin data for analysis
- Apply clustering techniques
- Conduct time series analysis
- Use the Analyze feature
- Use advanced analytics custom visuals
- Review Quick insights
- Apply AI Insights
Section 10: Work with AI visuals in Power BI
- Introduction to working with AI visuals
- Use the Q&A visual
- Find important factors with the Key influencers visual
- Use the Decomposition Tree visual to break down a measure
Section 11: Create and manage workspaces in Power BI
- Distribute a report or dashboard
- Monitor usage and performance
- Recommend a development life cycle strategy
- Troubleshoot data by viewing its lineage
- Configure data protection
Section 12: Secure Access With Row-Level Security
- Configure row-level security with the static method
- Configure row-level security with the dynamic method
Section 13: Manage datasets in Power BI
- Create dynamic reports with parameters
- Create what-if parameters
- Use a Power BI gateway to connect to on-premises data sources
- Configure a dataset scheduled refresh
- Configure incremental refresh settings
- Manage and promote datasets
- Troubleshoot service connectivity
- Basic knowledge of Power BI, including data import and basic DAX measures.
- Familiarity with creating basic reports and dashboards in Power BI.

SkillsFuture Ready
Singaporeans can use $500 SkillsFuture Credits for this training to offset the course fees.
Contact us for advise on how to go about claiming your SkillsFuture.
Get Started Today!

Learn By Doing
You learn best when you Do It Yourself.
We teach you, step by step, how you can learn new skills, build your knowledge and enhance your career prospects quickly & easily, with Practical Tips & Tricks!
Do You Have Any Questions or Need a Quotation?
Simple. Just tell us what you need. We’ll be glad to help you!
Some of the companies that experienced our trainings


How To Register
Register for Advanced Power BI Training Course in Singapore at Intellisoft
- Visit Our Website: Go to Intellisoft Training.
- Find the Course: Navigate to the “Advanced Power BI” course page.
- Fill Out the Form: Complete the registration form with your details & Submit the form
This hands-on, practical course will be taught by Power BI Guru Vinai Prakash, who has over 35 years of experience in data analysis and business intelligence.
Don’t miss this opportunity to learn from the best and transform your data analysis capabilities!
TESTIMONIALS FROM OUR ADVANCED POWER BI COURSE ATTENDEES
“The Advanced Power BI course exceeded my expectations. Vinai’s expertise and practical approach made complex concepts easy to understand. I feel much more confident in my ability to create impactful reports and dashboards now.” — Sarah Lim, Data Analyst, Vodafone
“Taking this course was a game-changer for my career. The hands-on exercises and real-world examples provided invaluable insights. Vinai is an outstanding instructor who truly cares about his students’ success.”
— John Tan, Director, Business Innovation

Accelerate Your Career With the Most Effective & Practical Training.
Training Course Fees
The full course fees for this training is S$1,200, before any Government funding.
For Singaporean/PR above 21 years, Training Grants are available.
For Foreigners, no government grants are available.
Grant Information
WSQ funding from SkillsFuture Singapore (SSG) is available to Singaporeans/PRs above 21.
(Both Individuals & Company Sponsored ).
Individual Singaporeans, 25 years & above can also use their SkillsFuture Credits for this training at Intellisoft.
Companies sending Locals & Foreign staff for training can avail SFEC Funding.
Use it to improve the skills of your entire department!
NTUC Members can utilize UTAP Funds to offset 50% of the remaining fees*.
Contact us for more information on How to apply for this SkillsFuture Grant.
Call +65-6252-5033 for Details or WhatsApp Now at +65-9066-9991
up to 70% Grant
$840 Funding by SSG-
Singaporeans Above 40 Years
-
Individuals
-
SME Companies
-
Individuals Can Use SkillsFuture
-
UTAP Funding*
up to 50% Grant
$600 Funding by SSG-
Below 40 Years
-
Individuals
-
SG / PR / MNC Companies
-
SkillsFuture (Singaporeans only)
-
UTAP Funding*
